XAU/USD Asset Sheet
Gold spot on one page — regime across all five timeframes, trend & control, support/resistance, moving averages, momentum, adaptive RSI bands, and the one-day σ range. Snapshot as of Aug 12, 2026.
All numbers below are from Aug 12, 2026 · 11:32 ET. Prices and engine data may have changed since this snapshot. This sheet describes conditions at one moment — it is not a forecast.
Open live XAU/USD chart →XAU/USD rose 1.2%. Daily regime: Thin Ice (shorter timeframes are calmer). Over the Wilder-smoothed lookback on the daily timeframe (Wilder period 14 (~27–28 bars effective memory)), upward directional movement has been greater than downward (+DI 29.6 vs −DI 9.2). R3 at 4,514.15 aligns with +1σ (0.33% apart). Short-TF ADX near 51 while weekly 25 still below trend-confirmation zone. RSI 70.0 is mid-band in bull trend (current) mode; MACD is above signal with histogram pressure building. Hurst 0.52 — no clear persistence either way; Over the Wilder-smoothed lookback on the daily timeframe (Wilder period 14 (~27–28 bars effective memory)), ADX is 32.0 — trend strength is elevated; use +DI vs −DI for direction. Daily trend tag is “trend established” — Wilder-smoothed ADX is 32.0 and structure agrees across timeframes. This describes conditions at the snapshot — not a forecast of direction.
- Continuation: hold 4,383.32 and accept above 4,423.41 – 4,434.79 toward 4,476.40 – 4,488.41 — the Wilder-smoothed read still favors upward movement; wait for follow-through at the level.
- Pullback case: retest 4,383.32 after a 0.7σ session — extensions need a floor to continue.
- Trap: trading the label instead of the level — 4,423.41 – 4,434.79 and 4,383.32 define the next decision, not the regime name.
Descriptive if/then scenarios only — not a buy or sell recommendation.
- R1 near 4,423.41 – 4,434.79 (Swing · prior-day high) — first hurdle above spot.
- S1 near 4,383.32 — first support if price slips; R2 / highs near 4,476.40 – 4,488.41.
- S2 near 4,356.49 – 4,363.38 if S1 fails.
One click to build a sheet, save it, or share it. Free to start.
Sign up free →Price map — what to watch on the chart
Daily candles to the snapshot date. Chart overlays the nearest 3 supports and 3 resistances; the S/R section below lists up to 4 per side. Top strip lists those chart levels; Y-axis shows short tags only (R1, S1, ±σ). Blue line = snapshot price.
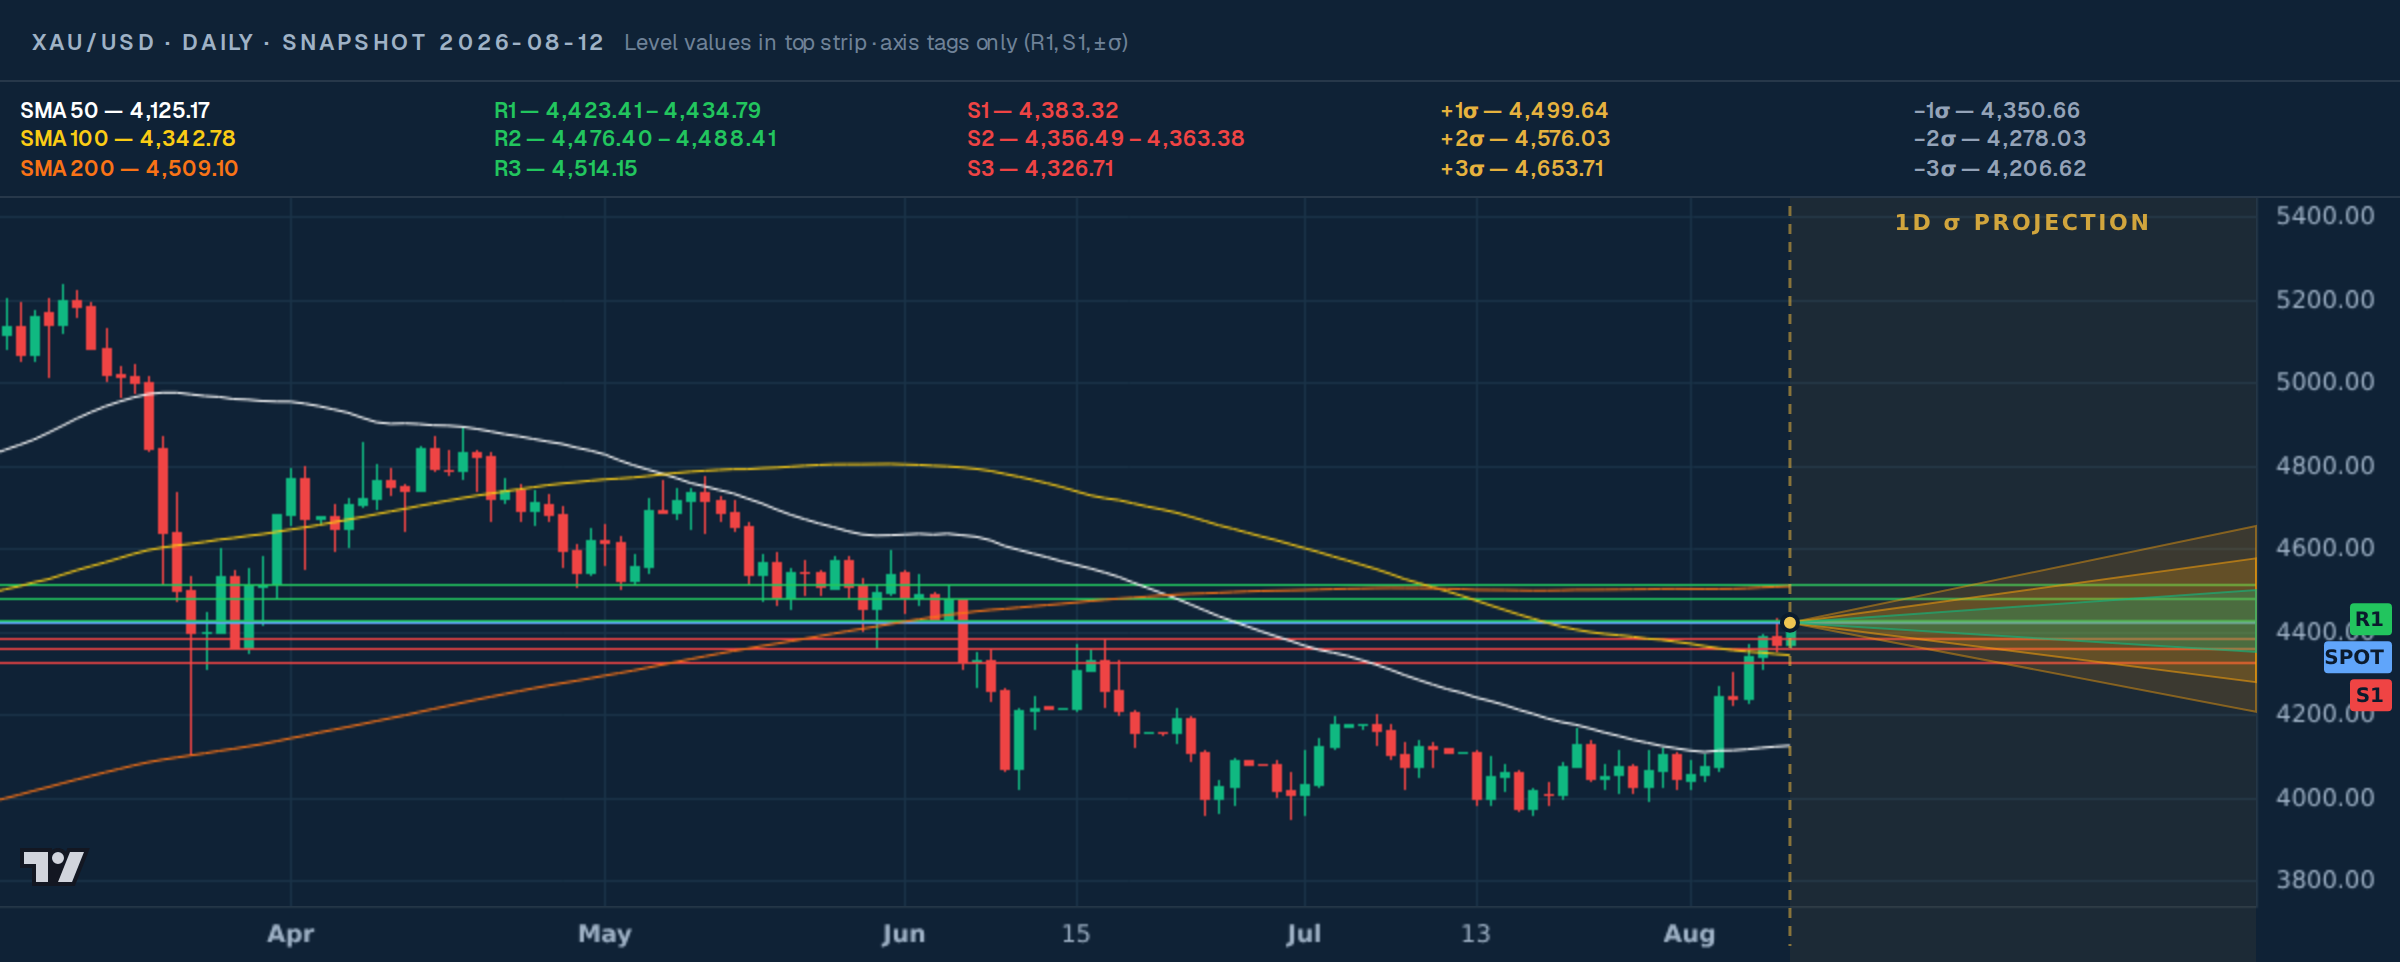
Daily σ price band
Typical one-day up/down range from 252 days of daily log returns — same formula as the live app.
252-day historical daily vol at snapshot: 1σ ≈ 1.68% (±$78.52 on this close). 252 trading days of daily log returns → μ and σ → spot × exp(μ ± k·σ). Same engine formula as Call for Action. Historical close-to-close vol — not ATR or options implied vol.
Support & Resistance
Prices where the move has paused before. Resistance sits above price; support sits below.
Swing · prior-day high
Swing
Swing
Swing
Swing
Swing · prior-day low
Swing
Swing
52-Week Range
Where today’s price sits between the 12-month low and high.
Regime — All Timeframes
The market “weather” on each timeframe — calm, expansion, fragile, or stressed. Timeframes can disagree.
Market Structure
Market structure on each timeframe — tags, bar color, and footer from the ordered ADX / Hurst / DI decision tree.
Trend Persistence (1D)
Daily Hurst persistence proxy, +DI/−DI (Wilder period 14 (~27–28 bars effective memory)), and ADX strength — same inputs as the structure engine.
| Signal | Value | Read |
|---|---|---|
| Hurst | 0.52 | Neutral band · persistence not fully confirmed |
| DI+ / DI− | 29.6 / 9.2 | Wilder-smoothed: upward movement > downward |
| ADX | 32.0 | Wilder-smoothed: trend strength elevated |
Moving Averages (1D)
Where price sits versus its 50-, 100-, and 200-day averages. Above = longer-term strength; below = weakness.
| MA | Price | Vs Spot |
|---|---|---|
| SMA 50 | 4,125.17 | Above +7.2% |
| SMA 100 | 4,342.78 | Above +1.8% |
| SMA 200 | 4,509.10 | Below −2.0% |
Momentum (1D)
Short-term speed of the move. RSI flags stretched conditions; MACD shows momentum building or fading.
| Signal | Value | Read |
|---|---|---|
| RSI (14) | 70.0 | Neutral · adaptive 40/80 band |
| MACD | 67.87 | Above signal · momentum firm |
| Signal / Hist | 25.03 / 42.84 | Buying pressure widening |
Adaptive RSI Bands
Daily structure: bull trend → adaptive oversold/overbought at 40/80 (not fixed 70/30). RSI 70.0 reads neutral. Trend is active but Hurst is in the neutral band — use the adaptive band and treat RSI stretches with extra caution.
- Learn how to read regime states →
Clear Skies through Full Storm — what each weather label means in practice.
- Understand Market Structure →
ADX, DI+/DI−, and Hurst — the cheat sheet behind the persistence table.
- Generate your own Asset Sheet →
Same package for any global asset — free to start.

Pick from thousands of global assets, generate a sheet in one click, download the PDF, and share your own posts.
Create your Asset Sheet →regimeintelligence.com · open Opportunity Scanner →Generated from live Regime Intelligence engine data. Descriptive context only — not a recommendation to buy or sell any security. Markets guarantee nothing. Educational use only. Not investment advice.
RI™ Asset Sheet Series · XAU/USD · Snapshot Aug 12 2026 11:32 ET
The XAU/USD Asset Sheet is the entire Regime Intelligence read on Gold spot, on one page — built from the same engine that powers the live app. Download it, share it, keep it next to your charts.
What's inside
- Regime across all five timeframes — 15m, 1h, 4h, 1D, 1W.
- Trend & control per timeframe — ADX, DI, and Hurst.
- Support/resistance, key levels, and 50/100/200-day moving averages.
- Momentum, adaptive RSI bands, and the one-day σ price range.
This sheet is a dated snapshot (Aug 12, 2026). For the live, always-current XAU/USD read, open it in the app.