Macro Desk Note · August 12, 2026
The Fed at Crossroads
The Wedge, the Steepener, and the Silence
What three FOMC statements, two inflation gauges, one SEP, and one bear steepener say about the Warsh Fed
Sherif Saad · Regime Intelligence · Not financial advice
THESIS
Three claims, each falsifiable.
The Federal Reserve is on hold at 3.50–3.75% for a fifth consecutive meeting, and since late July the market has repriced September from roughly 76–80% hike odds to as low as ~40% (Aug 7), settling near a coin flip at ~45% — a swing of nearly 40 percentage points across the July FOMC and the July payrolls report (released Aug 7). Most of the commentary explaining that move is anchored on the wrong inflation series, and nearly all of it has ignored the most informative price action of the quarter.
Three claims, each falsifiable:
- The inflation debate is a measurement debate. Core CPI at 2.5% (July) and core PCE at 3.3% (June) are sending materially different signals about underlying inflation. The gap is +80 basis points on latest-available prints (+70bp on matched June data: core CPI 2.6% vs core PCE 3.3%) — a reversal of the usual relationship, in which core CPI typically runs above core PCE. Because the Federal Reserve's inflation objective is defined in terms of PCE inflation, analyses that rely primarily on core CPI risk understating the hurdle to policy easing.
- The bond market did not read July 29 as hawkish. The Committee held with three dissents in favor of a hike — and the 30-year yield rose nine basis points while the 2-year yield fell four (a bear steepener: long-end sell-off, front-end rally). That is not a rate-path reaction. It is a credibility reaction.
- Removing forward guidance has a measurable price. It is showing up in event-day volatility and in the width of pre-meeting futures distributions, not in the level of rates. This is the first Fed communications regime change in fifteen years that can be evaluated empirically rather than argued about.
Position: hold in September, with the burden of proof on the hawks. Kill conditions stated at the end.
THREE STATEMENTS, TWO CHAIRS, ONE ARGUMENT
Kevin Warsh was sworn in on May 22, 2026, succeeding Jerome Powell, who remains on the Board of Governors with a term running to 2028. The three most recent FOMC statements therefore straddle the transition.
| Apr 29 — Powell | Jun 17 — Warsh | Jul 29 — Warsh | |
|---|---|---|---|
| Vote | 8–4 | 12–0 | 9–3 |
| Length | ~341 words | 130 words | 166 words |
| Forward guidance | Retained under protest | Deleted | Absent |
| Dissent rationale stated | Yes | — | No |
| Target range | 3.50–3.75% | Unchanged | Unchanged |
April: a fight over the reaction function, not the rate
Powell's final statement preserved the architecture built over a decade: the Committee would weigh "the extent and timing of additional adjustments," was attentive to risks on both sides of the mandate, and remained strongly committed to returning inflation to 2%.
The vote is where the meeting lives. Eight members supported the action. Miran dissented in favor of a 25bp cut. Hammack, Kashkari, and Logan dissented while agreeing with the rate decision — they objected to retaining an easing bias in the language. Four dissents was the most since October 1992.
Read that carefully. Three-quarters of the dissent was about the reaction function, not the policy setting. A committee that agrees on the rate and splits on the guidance is a committee that no longer agrees on what it is trying to communicate. Everything Warsh did in June follows directly from that.
June: the guidance apparatus is deleted
Warsh's first statement ran 130 words against an average above 300 for the Powell statements earlier in 2026. What came out: the dual-mandate framing paragraph, the "extent and timing" clause, the two-sided-risk sentence, and the entire closing paragraph on monitoring incoming information.
What went in was a single declarative commitment — the Committee will deliver price stability — plus descriptive content the prior regime never carried, characterizing productivity growth and capital investment as strong. Warsh said guidance was not well suited to the current policy conjuncture. The vote was unanimous.
He also declined to submit a dot to the Summary of Economic Projections (SEP), meaning the published median for the first time excludes the chair.
July: the text stops moving and the vote starts talking
The July statement is textually near-identical to June — the substantive prose change is that the ample-reserves policy went from "reaffirmed" to "continuing." The key news from the meeting is in the vote line: Hammack, Kashkari, and Logan dissented in favor of a 25bp hike. It is the first time since September 2016 that three policymakers dissented in the same direction.
Under Powell, the statement explained why dissenters dissented. This one did not.
What actually changed
Removing forward guidance does not remove information. It relocates it.
Powell's statements described how the Committee would respond to data — a conditional mapping from inputs to policy. Warsh's describe what outcome the Committee will produce, with no path attached. The result is that the vote tally and the dissent count have become the highest-bandwidth channel the Fed still operates, and the Chairman has stopped annotating them.
This is a deliberate transfer of uncertainty. Under a stated reaction function, the market's residual uncertainty is about the data. Under an outcome commitment with no path, the residual uncertainty is about the Fed. Section V argues that this transfer has a measurable price.
THE SEP — JUNE 2026
What the SEP is
The Summary of Economic Projections (SEP) is the Fed's quarterly forecast packet. It is released at four FOMC meetings each year: March, June, September, and December.
At each SEP meeting, FOMC participants (governors plus regional bank presidents) submit individual forecasts for:
- real GDP growth
- the unemployment rate
- headline PCE inflation
- core PCE inflation (PCE excluding food and energy — the Fed's operational inflation target)
- the appropriate federal funds rate path (the dot plot)
The SEP publishes the median, central tendency (drops the three highest and three lowest), and range across participants. The dot plot shows how many participants placed their year-end rate projection at each level.
Important: dots are each participant's view of appropriate policy under their own forecast — not a Committee vote and not a promise.
Latest release as of this writing: June 17, 2026 (meeting dates June 16–17). The next SEP publishes with the September 15–16, 2026 FOMC meeting. Warsh did not submit a dot; 18 of 19 participants submitted projections.
Source: FOMC projections, June 17, 2026
Median projections: March vs June
| Variable | March 2026 median | June 2026 median | Change |
|---|---|---|---|
| Fed funds, Q4 2026 | 3.4% | 3.8% | +40bp |
| Core PCE, Q4 2026 | 2.7% | 3.3% | +60bp |
| Headline PCE, 2026 | 2.7% | 3.6% | +90bp |
| Real GDP, 2026 | 2.4% | 2.2% | −20bp |
| Unemployment, Q4 2026 | 4.4% | 4.3% | −10bp |
The June SEP was the most consequential document of the quarter, and it was hawkish in a way the unanimous 12–0 vote concealed.
How to read the funds-rate shift: the current target range is 3.50–3.75% (midpoint 3.625%). The March median of 3.4% implied roughly one 25bp cut by year-end 2026. The June median of 3.8% implies roughly one 25bp hike — a 40bp swing in three months.
Full June 2026 median path
| 2026 | 2027 | 2028 | Longer run | |
|---|---|---|---|---|
| Real GDP growth | 2.2% | 2.3% | 2.2% | 2.0% |
| Unemployment (Q4 avg) | 4.3% | 4.3% | 4.2% | 4.2% |
| Headline PCE inflation | 3.6% | 2.3% | 2.0% | 2.0% |
| Core PCE inflation | 3.3% | 2.5% | 2.1% | — |
| Fed funds rate (appropriate) | 3.8% | 3.6% | 3.4% | 3.1% |
The Committee's own forecast never brings core PCE to 2% within the projection window — the median ends at 2.1% in 2028, still above target — which, against realized outcomes since 2021, would make eight consecutive years above 2%.
The dot plot: year-end 2026 fed funds
Current policy midpoint: 3.625% (range 3.50–3.75%). Each dot is one participant's year-end 2026 projection of appropriate policy:
| Year-end 2026 funds midpoint | Participants | Implied move from 3.625% |
|---|---|---|
| 3.375% | 1 | Cut (−25bp) |
| 3.625% | 8 | Hold |
| 3.875% | 3 | Hike (+25bp) |
| 4.125% | 5 | Hike (+50bp) |
| 4.375% | 1 | Hike (+75bp) |
| Total | 18 |
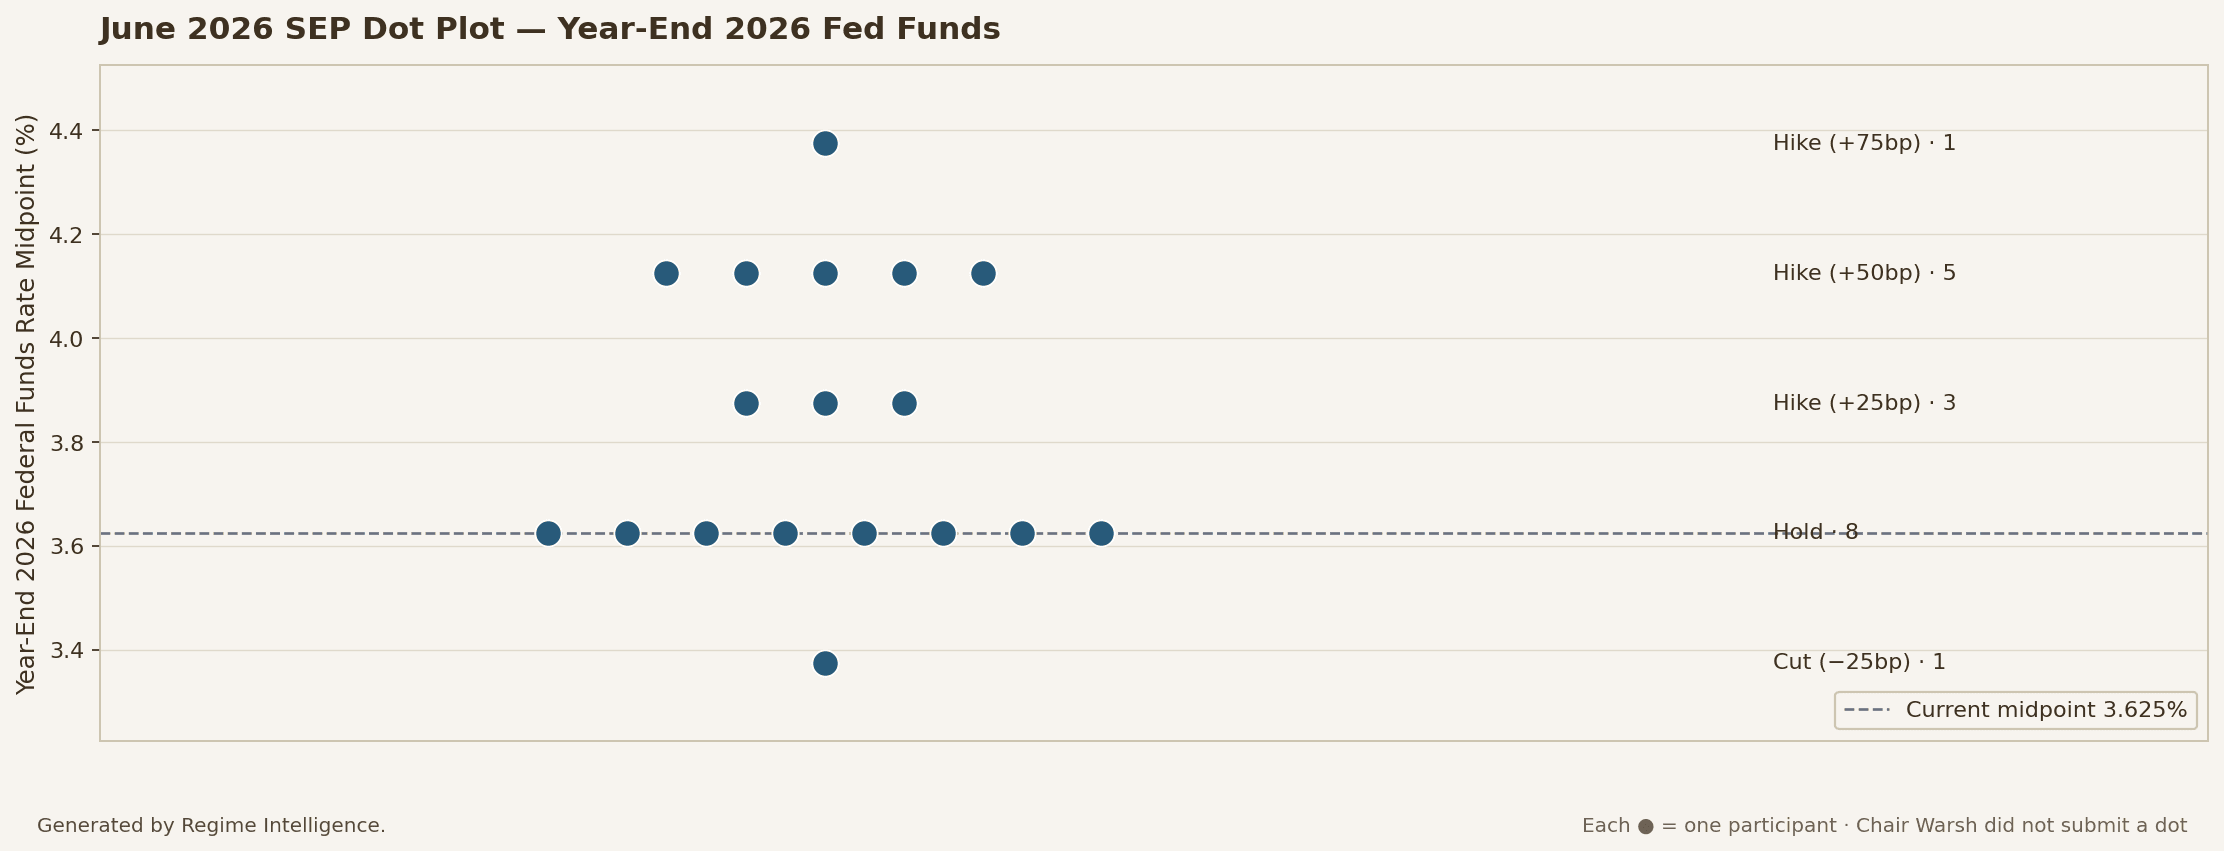
June 2026 SEP · Year-end 2026 federal funds rate midpoint
Summary: 9 participants project at least one hike; 8 project hold; 1 projects a cut. Among the hikers: three at +25bp, five at +50bp, one at +75bp.
Year-end 2026 dot plot (each ● = one participant):
3.375% ● (1 cut)
3.625% ●●●●●●●● (8 hold) ← current midpoint
3.875% ●●● (3 hikes of +25bp)
4.125% ●●●●● (5 hikes of +50bp)
4.375% ● (1 hike of +75bp)
The split is nine--nine on direction (hike vs hold/cut), with Warsh abstaining from the dot plot entirely. The median is 3.75% (reported as median of 3.8%) which is the midpoint of 3.625% and 3.875% of an evenly divided committee — an artifact of a tie, not a center of gravity. Treating 3.8% as "the Fed's view", in my opinion, is overstating the Committee's coherence.
Three observations from the June SEP
- The inflation outlook deteriorated while the growth outlook softened. The June SEP marked a clear stagflationary shift in the median outlook. Relative to March, median core PCE inflation for 2026 was revised up to 3.3% from 2.7% (+60bp), while median real GDP growth was revised down to 2.2% from 2.4% (−20bp). Unemployment was revised slightly lower to 4.3% from 4.4%, implying that participants no longer expect inflation to ease primarily through a materially weaker labor market.
- Participants became substantially more concerned about inflation risks than about growth risks. The most striking change in the SEP was not the median forecast but the distribution of risks. Per the June SEP risk table, seventeen of eighteen participants who filed assessments judged risks to core PCE inflation weighted to the upside (one broadly balanced), up from sixteen of nineteen in March, while the median policy path remained sharply divided. The message is that the Committee reached broad agreement on the inflation problem but not on the appropriate policy response.
- The median dot masked an unusually divided Committee. The published median federal funds rate for year-end 2026 (3.8%) was produced from an 18-dot distribution split between nine participants expecting at least one rate hike and nine expecting either no change or a cut. At the same time, Chair Kevin Warsh chose not to submit a rate projection, meaning the Chair's preferred policy path is absent from the dot plot. The median therefore summarizes the distribution mathematically, but it should not be interpreted as evidence of broad consensus within the Committee.
THE WEDGE
Two inflation gauges, opposite conclusions.
This is the analytical center of the piece.
The prints
CPI (released August 12; July data): headline +0.1% m/m and 3.4% y/y; core +0.2% m/m and 2.5% y/y. Both annual rates fell a tenth from June; every figure landed on consensus. June had printed −0.4% m/m headline with core flat. May headline ran at 4.2% y/y; May core at 2.9% y/y (BLS, June 10, 2026).
Energy fell 1.5% on the month but remains 14.7% higher than a year ago, with gasoline up 24.6%. Shelter rose 0.1%; the BLS reported that shelter accounted for roughly two-thirds of July's headline increase — the published +0.1% m/m headline rounds a smaller unrounded net change.
PCE (latest available: June data, released July 30; July data prints August 26): headline −0.1% m/m and 3.7% y/y, down from 4.1% in May; core +0.1% m/m and 3.3% y/y, down from 3.4%. May headline PCE was +0.5% m/m and 4.1% y/y; May core was +0.3% m/m and 3.4% y/y. May's year-over-year readings were the highest since April 2023 (headline) and October 2023 (core).
The inversion
| Core CPI | Core PCE | Gap | |
|---|---|---|---|
| Latest y/y | 2.5% (Jul) | 3.3% (Jun) | +80bp |
| Matched Jun y/y | 2.6% | 3.3% | +70bp |
| Typical sign | — | — | PCE below CPI by 25–50bp |
+80bp uses the latest available print for each series; +70bp holds both to June. Either gap is inverted against a typical −25 to −50bp structural spread.
Core PCE normally runs below core CPI. Shelter is roughly 40% of core CPI and about 18% of core PCE; PCE's chain-weighting also captures substitution that CPI's fixed basket does not. The structural expectation is a negative gap.
The gap is currently positive and large. The mechanism is not mysterious:
- Shelter is decelerating. This flatters core CPI far more than core PCE, because of the weight difference.
- PCE's hot categories are ones CPI sources differently or not at all. Medical care services in PCE are built from producer price data, not the CPI's consumer-facing series. Airfares likewise do not feed the deflator directly. Financial services and insurance are imputed in PCE and largely absent from CPI.
- Energy pass-through into core goods works through both, but PCE's goods weighting is higher.
July's CPI internals reinforce this. Medical care and airline fares were among the categories that rose — and both are precisely the components whose CPI strength does not translate into the deflator. The implication is that core PCE for July (August 26 release) may print differently from what CPI internals suggest.
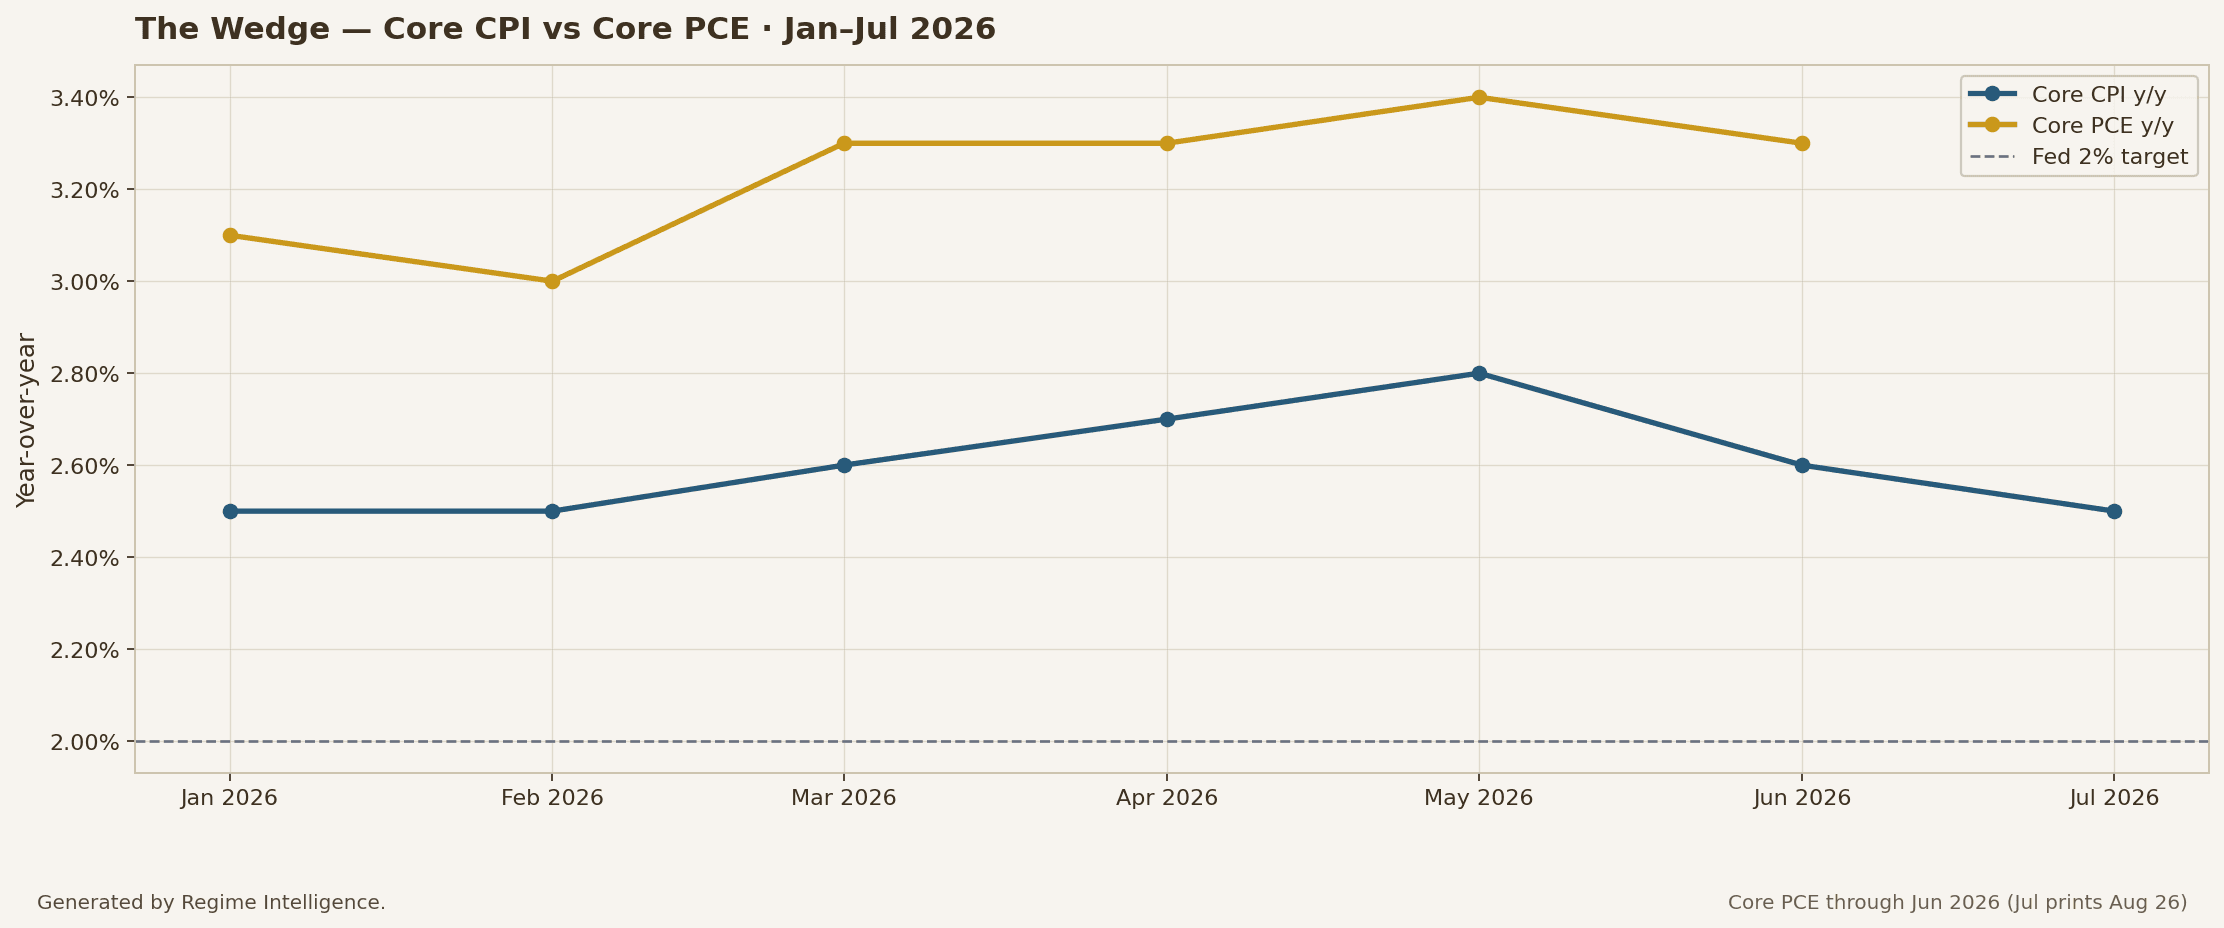
Core CPI vs Core PCE year-over-year · Jan–Jul 2026
Why this decides the article
An analyst working from core CPI at 2.5% concludes inflation is essentially back to target and the Fed is being stubborn. An analyst working from core PCE at 3.3% concludes the Fed is 130 basis points from its goal and has been for years.
The Fed's mandate is specified in PCE terms. The June SEP forecasts core PCE. The dissenters are dissenting on PCE. Every piece of commentary that led with "core CPI at 2.5%" on August 12 is measuring the wrong thing.
The forecastable question is when the wedge closes and in which direction. Shelter disinflation has further to run, which keeps downward pressure on core CPI. Medical services and insurance have shown no comparable deceleration. Base effects from the March energy spike (+0.9% m/m headline CPI) do not roll out of year-over-year comparisons until Q1 2027. The reasonable prior is that the gap narrows slowly and from the CPI side rising, not the PCE side falling.
What this piece does not have, and what would settle it: trimmed-mean PCE (Dallas Fed), median and 16% trimmed CPI (Cleveland Fed), and sticky-price CPI (Atlanta Fed). In a supply-shock regime both headline and core are contaminated by pass-through, and trimmed-mean measures are the only ones that answer whether the pressure is narrow or broad.
THE STEEPENER
What the market said on July 29.
Here is the price action almost nobody wrote up.
The Committee held rates. Three members dissented in favor of a hike — the most hawkish dissent configuration in a decade. On any conventional reading, that is a hawkish meeting.
The FedWatch series tells the story in one line: September hike odds fell from roughly 76% the day before the meeting to about 58% immediately after. The Committee held with three hawkish dissents and the market came away less convinced a hike was coming.
The yield and equity response during and after the press conference (Treasury moves are yield changes; negative = rally, positive = sell-off):
| Move | Level | |
|---|---|---|
| 2-year | −4bp | 4.236% |
| 10-year | +7bp | 4.671% |
| 30-year | +9bp | 5.193% |
| S&P 500 | −1.5% | — |
| Dow | −1.6% (−840 pts) | — |
A bear steepener on a hawkish hold is an unusual and highly specific signal.
If the market had read the dissents as raising the odds of tightening, the front end would have typically sold off. It rallied. If the market had read the meeting as dovish, the long end would have rallied too. It sold off hardest of all.
The most coherent reading is that the market simultaneously reduced its expectation of near-term tightening and raised its required compensation for holding long-duration exposure. That is not a rate-path revision. It is a repricing of the Fed's tolerance for above-target inflation over the horizon that matters for a 30-year bond.
The current curve makes the same point statically. Against an effective funds rate near 3.63% (as of August 10 close):
| Level | Spread vs policy | |
|---|---|---|
| 2-year | 4.24% | +61bp |
| 10-year | 4.71% | +108bp |
| 30-year | 5.25% | +162bp |
| 2s10s | +47bp | |
| 10s30s | +54bp |
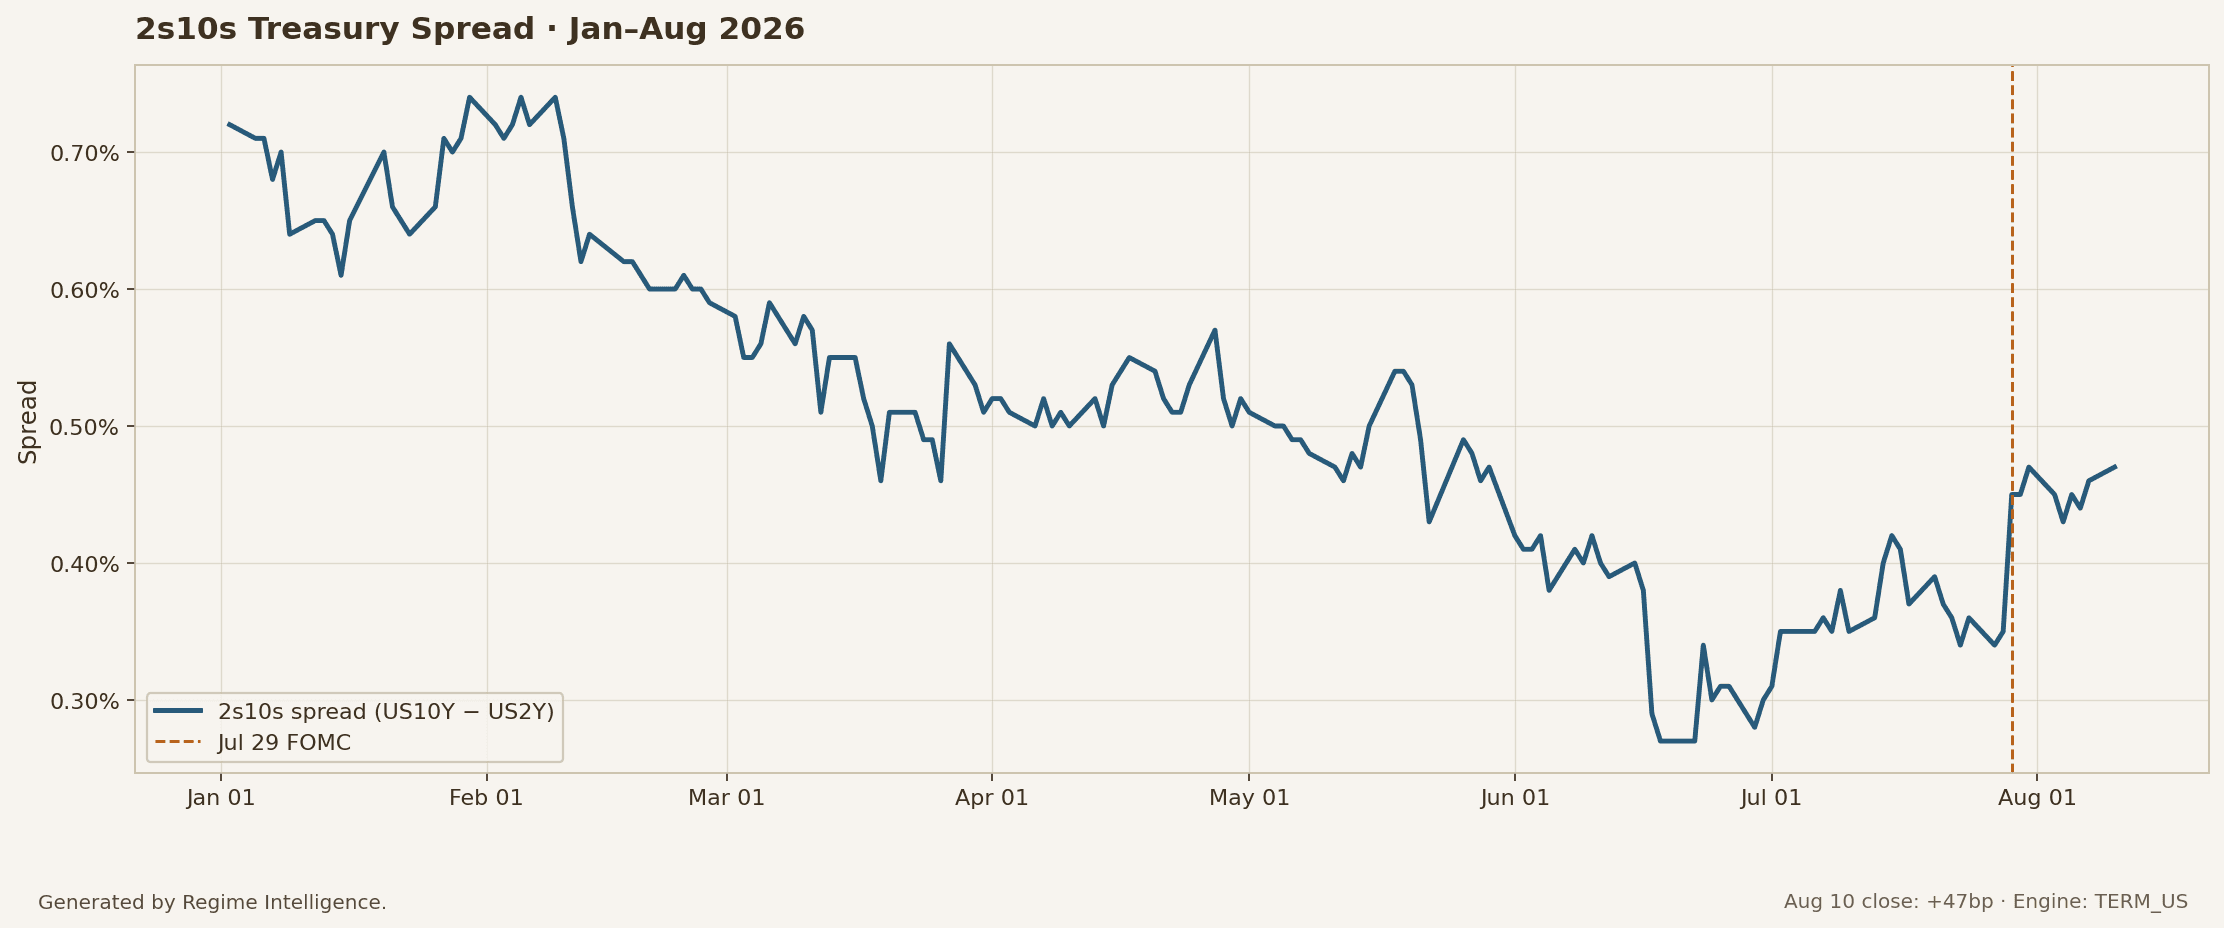
2s10s Treasury spread · Jan–Aug 2026
The long end does not appear to be pricing a Fed that is behind the curve but poised to catch up quickly. Rather, it is consistent with a market that expects inflation risks and/or term premium to remain elevated for longer, implying less confidence that policy will return inflation sustainably to target.
The competing explanation, stated fairly: the 30-year move may reflect fiscal supply and term premium unrelated to monetary credibility. That is a real alternative and this analysis cannot fully separate them from price data alone. The test is whether long-dated breakevens moved with nominal yields on the day — a credibility repricing shows up in breakevens, a supply story shows up in real yields. That decomposition is the single most valuable follow-up available.
THE SILENCE
Opacity has a measurable price.
Warsh has made the Fed's communications a deliberate object of reform rather than an incidental one. The changes so far:
- Statement length cut roughly 60%
- Forward guidance removed entirely
- No chair dot in the SEP, with public speculation that the dot plot may not survive
- Dissent rationales no longer explained
- Reduced meeting frequency raised at the July FOMC (statute requires a minimum of four per year)
- Post-meeting press conferences confirmed only through year-end 2026
- Five task forces launched in July, co-led by external advisers, with recommendations due by year-end
The case for it is coherent: guidance calcifies into commitment, commitment becomes a hostage to data, and a committee that has missed its target every year since 2021 has limited credibility to spend on promises.
The case against it is empirical, and it can be tested.
If the Fed supplies less information between meetings, market participants must extract more of it at meetings. The prediction is straightforward: event-day volatility rises, pre-meeting distributions widen, and the marginal value of individual speakers increases.
Early evidence is consistent:
- Going into July 29, fed funds futures carried an unusual 35–65 split on the outcome of the meeting itself. Fed decisions are not normally genuine coin flips at the margin.
- The July 29 equity reaction — the Dow down 840 points during a press conference following a widely expected hold — is a large move for a meeting that changed no policy.
- By August 12, September hike odds had drifted back to ~45% after the July payrolls report (released Aug 7) — neither the July FOMC nor that release collapsed pre-meeting uncertainty into a narrow band, consistent with the wider T-1 distributions the test above would measure.
The measurement anyone can run: chart the width of the FedWatch distribution at T-1 day across the last eight FOMC meetings, split at the June transition. If the post-transition distributions are systematically wider, the cost of opacity is quantified. If they are not, the reform is free and the critics are wrong.
This is, to my knowledge, the first Fed communications regime change since 2011 that admits a clean empirical test. It deserves one.
THE LABOR BREAK
The repricing since July 29 was driven by employment, not inflation.
July payrolls (released August 7): −23,000 against consensus of +83,000. Unemployment fell to 4.1% from 4.2%. Participation dropped to 61.4%, the lowest in over five years.
Revisions: May cut by 66,000 to 63,000; June cut by 37,000 to 20,000. Combined, 103,000 jobs erased. The trailing twelve-month average is now 34,000 a month.
Wages: average hourly earnings rose two cents to $37.62, up 3.2% year-over-year — the weakest since May 2021.
Two decompositions that change the interpretation:
Unemployment fell for the wrong reason. With participation down 0.7 percentage points since January and the employment-population ratio down 0.5, the decline in the unemployment rate reflects labor force exit, not hiring. The household survey and the establishment survey are telling the same story through different arithmetic.
Real wages are negative. Nominal earnings growth of 3.2% against headline CPI of 3.4% means purchasing power is contracting. With the savings rate at 2.7% and June spending growth exceeding income growth, households are funding consumption from the balance sheet. That is a demand channel with a finite runway.
The composition offers partial relief — government shed 53,000, concentrated in local education (−50,000), which has the signature of a seasonal adjustment misfire and may reverse. Private payrolls rose 30,000. But temporary layoffs rose 153,000 to 921,000, which does not.
Scheduled risk: on August 28, BLS publishes its preliminary estimate of the annual benchmark revision alongside Q1 2026 QCEW data (10:00 ET). This is employment data only — not inflation. Given that ordinary monthly revisions just removed 103,000 jobs, a benchmark revision lands in a market with no tolerance for further downside. In my opinion, this is an underpriced event.
SPY · Regime Intelligence engine (Asset Sheet cards)
SPY · SPDR S&P 500 ETF Trust
$768.56 ▼ −1.18 (−0.2%)
Snapshot · Aug 6, 2026 · 18:11 ET
Same five-state regime labels and Market Structure reads as the RI Asset Sheet — pulled from the live engine at snapshot time.
Regime — all timeframes
Market structure
WHERE PRICING STANDS
| Date | September hike probability (approx.) | Catalyst |
|---|---|---|
| Mid-May | ~One 2026 cut priced | Pre-transition (March SEP) |
| Jun 17 | Cut removed, hike added | June SEP revision |
| Jul 28 | ~76–80% hike | Hawkish positioning |
| Jul 29 (post) | ~58% hike | Three hawkish dissents — odds fell |
| Aug 7 | ~40% hike / ~60% hold | Payrolls −23k |
| Aug 12 (post-CPI) | ~45% hike / ~55% hold | CPI in line |
FedWatch as of August 12, 2026, ~1:00 PM ET. Re-pull at publication. The largest swing in this table is July 28 (~76–80%) to August 7 (~40%) — roughly 40 percentage points; the Jul 29 post-meeting print (~58%) to August 12 (~45%) is only ~13 points.
Methodological caveat, stated because it matters. CME FedWatch probabilities are risk-neutral, not physical. They embed whatever premium hedgers are paying, and in a binary hike-versus-hold environment with a deteriorating labor market, the measure will overstate the tail that carries the most hedging demand. Separately, 30-day fed funds futures settle on the monthly average effective rate, so a mid-month meeting — September 15–16 — requires an assumption about intra-month averaging to back out an implied probability. Treat these as a well-constructed indicator, not a forecast, and timestamp every figure.
The oil overlay. Brent traded above $114 in March, collapsed to $69 on July 2 following the US--Iran memorandum of understanding, spiked to $105 on July 23 after renewed attacks on Hormuz transits, and sits near $88. The EIA's August outlook forecasts roughly $85 for Q3, $78 for Q4, and $69 in 2027, with about 0.6 mb/d of disruption persisting through end-2027.
This is the definition of a supply shock, and the textbook prescription is to look through it — conditional on expectations remaining anchored. That conditional is the entire policy debate, and it cannot be resolved from realized inflation alone. Five-year five-year forward breakevens, ten-year breakevens, the Michigan survey, and the NY Fed Survey of Consumer Expectations are the relevant instruments. Their absence from this analysis is its principal limitation.
THE INSTITUTIONAL OVERLAY
Three structural facts belong in any assessment of this Fed's reaction function.
The dissent fault line runs along appointment structure. All three July dissenters — Hammack, Kashkari, Logan — are regional Reserve Bank presidents. No governor dissented. Governors are presidential appointees confirmed by the Senate; regional presidents are selected by their banks' boards. The hawkish pressure on this Committee is concentrated in the segment least exposed to political appointment. Whatever one concludes about causation, the correlation is worth stating, and the 2027 voter rotation will change the arithmetic.
Independence is a term premium input. On June 29, 2026, the Supreme Court denied the government's application for a stay (Trump v. Cook, No. 25A312) — an interlocutory ruling on whether Cook could be removed while litigation proceeds, not a final merits decision on Fed removal power. The Court reasoned that Cook was likely entitled to pre-termination notice and an opportunity to respond before removal; the parallel FTC case the same day overturned Humphrey's Executor and expanded presidential control over other independent agencies. Why the Fed was treated differently turns on the carve-out the Court has repeatedly gestured at — the uniquely structured, quasi-private central bank — which is dicta in this posture, not holding, and is now the load-bearing element of Fed independence. The August 5 White House letter — formal notice and a response deadline — is not defiance of the Court; it is execution of the procedure the Court specified, which supplies a roadmap rather than a barrier. That makes institutional risk a sharper term-premium input than a flat "Fed independence preserved" reading would imply. The Justice Department's investigation of Powell was terminated in April, though the Fed's Inspector General inquiry continues. Powell remains on the Board. Warsh has declined to engage substantively, saying he believes in the rule of law and will follow the Court.
The analytical point is not political. It is that a 30-year yield at 5.25% with 10s30s at +54bp is compensation for something, and institutional risk is a candidate alongside fiscal supply and inflation risk. Distinguishing among them requires the breakeven decomposition described in Section IV.
Reserve management, not QE. Both Warsh statements affirm ample reserves; implementation notes direct the Desk to purchase Treasury bills to maintain that floor — the reserve-management framework the Fed adopted after the September 2019 repo episode, explicitly distinct from balance-sheet stimulus. Bill purchases still expand the balance sheet in absolute terms, and the pace matters for front-end Treasury bill supply and take-up at the reverse repo facility — short-rate plumbing that is real but separate from QE-style accommodation.
DXY · Regime Intelligence engine (Asset Sheet cards)
DXY · US Dollar Index (composite)
$99.9802 ▲ +0.29380 (+0.3%)
Snapshot · Aug 6, 2026 · 18:42 ET
Same five-state regime labels and Market Structure reads as the RI Asset Sheet — pulled from the live engine at snapshot time.
Regime — all timeframes
Market structure
POSITION, KILL CONDITIONS, CATALYSTS
Base case: hold in September. The July CPI reduced the urgency while the labor break removed the confidence, and a Committee that could not agree on statement language in April is unlikely to deliver a first hike into negative payroll prints. The hawks have three votes and no governors. Their strongest counter is that financial conditions have eased while the policy rate has not — effective policy has loosened even on hold, which is the case for acting; this note does not model that channel directly and treats it as a stated limitation.
This view is wrong if:
- July core PCE (August 26) prints above 0.30% month-over-month
- August payrolls (released Sep 4) rebound above 100,000 with upward revisions
- Brent sustains above $100 into September on a Hormuz re-escalation
- Long-dated breakevens break decisively higher, which would convert the supply-shock argument into an expectations argument and force a response
This view understates the risk if:
- The August 28 benchmark revision removes another large tranche of employment, in which case the debate shifts from hike-versus-hold to hold-versus-cut faster than current pricing allows
Scheduled catalysts
| Date | Event | Why it matters |
|---|---|---|
| Aug 26 | July PCE (Personal Income and Outlays) | The Fed's actual target inflation series — 8:30 ET |
| Aug 27–29 | Jackson Hole (Warsh speaking) | First extended framework statement from the new chair |
| Aug 28 | Preliminary jobs benchmark revision + Q1 2026 QCEW | Employment tail risk only — 10:00 ET |
| Sep 4 | August payrolls | Confirms or refutes the labor break |
| Sep 11 | August CPI | Final inflation input before the meeting |
| Sep 15–16 | FOMC (+ September SEP) | Decision and updated dot plot |
DATA APPENDIX
Policy: Target range 3.50–3.75%, unchanged since the December 2025 cut. IORB 3.65%. Standing repo 3.75%. ON RRP 3.50%, $160bn per-counterparty cap. Effective funds rate ~3.63%.
Inflation:
| Series | Reading |
|---|---|
| CPI July | +0.1% m/m / 3.4% y/y; core +0.2% / 2.5% |
| CPI June | −0.4% m/m / 3.5% y/y; core 0.0% / 2.6% |
| CPI May | +0.5% m/m / 4.2% y/y; core +0.2% / 2.9% |
| PCE June (released Jul 30) | −0.1% m/m / 3.7% y/y; core +0.1% / 3.3% |
| PCE May | +0.5% m/m / 4.1% y/y; core +0.3% / 3.4% |
| PCE April (BEA, May 28) | +0.4% m/m / 3.8% y/y; core +0.2% / 3.3% |
Labor: July payrolls −23k; U3 4.1%; participation 61.4%; AHE +3.2% y/y; 12-month average payroll gain 34k; May/June revised −103k combined; private +30k, government −53k; temp layoffs 921k (+153k).
Rates (Aug 10 close): 2y 4.24%, 10y 4.71%, 30y 5.25%. 2s10s +47bp, 10s30s +54bp.
Energy: Brent ~$88; EIA forecasts $85 (3Q26), $78 (4Q26), $69 (2027).
June 2026 SEP medians: Fed funds Q4 2026: 3.8%; core PCE Q4 2026: 3.3%; headline PCE 2026: 3.6%; GDP 2026: 2.2%; unemployment Q4 2026: 4.3%.
SOURCES AND VERIFICATION NOTES
Primary: FOMC statements and implementation notes of April 29, June 17, and July 29, 2026; June 2026 Summary of Economic Projections; March 2026 SEP. BLS Employment Situation, July 2026; CPI, July 2026 (released August 12); CPI, May 2026 (core y/y 2.9%, released June 10). BEA Personal Income and Outlays, June 2026 (released July 30); April 2026 (core y/y 3.3%, released May 28). BEA release schedule (July PCE: August 26). EIA Short-Term Energy Outlook, August 11, 2026.
Secondary: CME FedWatch as reported by CNBC and market data services on the dates cited; statement word counts per CNBC (June 130 words vs April 341).
Analysis of publicly available data and published central bank communications. Not investment advice.

Live regimes, macro context, and institutional-grade multi-timeframe analysis on thousands of global assets — web and mobile.