SPY Asset Sheet
SPDR S&P 500 ETF Trust on one page — regime across all five timeframes, trend & control, support/resistance, moving averages, momentum, adaptive RSI bands, and the one-day σ range. Snapshot as of Aug 7, 2026.
All numbers below are from Aug 8, 2026 · 01:18 ET. Prices and engine data may have changed since this snapshot. This sheet describes conditions at one moment — it is not a forecast.
Open live SPY chart →At this snapshot, the daily bar sat in Storm Warning (weekly: Thin Ice). On the daily bar, ADX was 22.1 (below 25 · not confirmed) while DI+ led DI− (30.7 / 17.4) and Hurst sat near 0.50 (random walk). Price sat above the 50-day/100-day/200-day average(s). Put together: buyers had the daily wheel, and trend strength was still forming (ADX in the 20s — not fully confirmed). MACD and the histogram lined up with that same side — control and momentum were telling one story. RSI was stretched to the overbought side — control and momentum agreed, but stretch is the soft spot where advances may pause or cool. Hurst sat near random walk — persistence was not a strong vote either way. This describes conditions at the snapshot — not a forecast of direction.
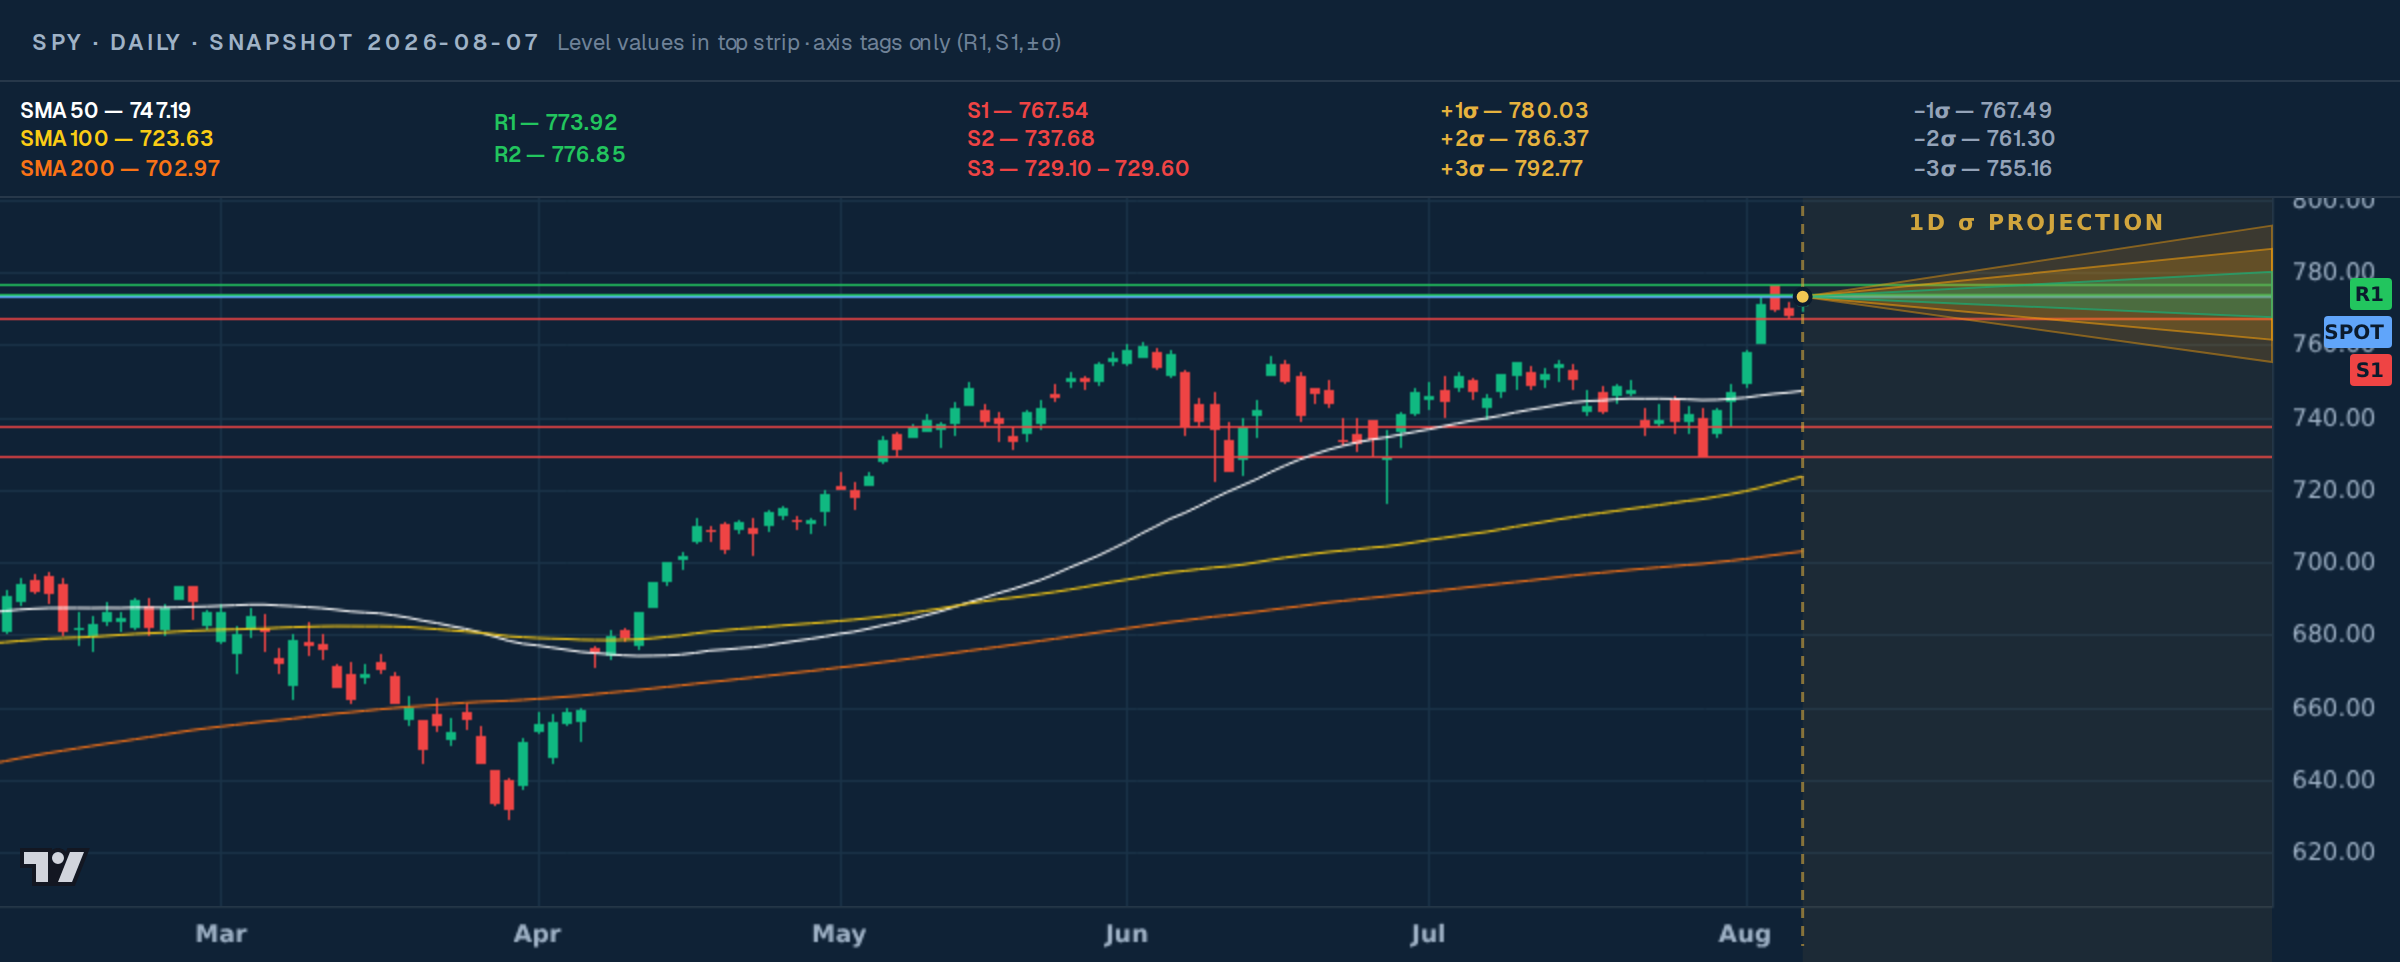
- Levels: R1 at $773.92 — first resistance above snapshot price (Swing).
- Levels: A sustained move above R1 could bring R2 at $776.85 into focus; a failure could see price retreat toward S1 at $767.54 and S2 at $737.68 if S1 fails.
- Levels: Monitor participation on any test of R1 or S1 — thin moves are less convincing than volume-backed acceptance.
- MAs: Spot vs 50/100/200 — $747.19 (Above +3.5%), $723.63 (Above +6.8%), $702.97 (Above +10.0%).
- Momentum: Adaptive RSI in Transition (current) mode — OB/OS at 65/35; RSI 66.0 reads lean OB · 35 band. MACD Above signal; Bull widening.
- Storm Warning daily backdrop — weekly read Thin Ice. Buyers led the daily bar; momentum agreed.
- With buyers and momentum aligned, the map question is whether R1 near $773.92 gives way on acceptance — or whether a failure drops attention back to S1 near $767.54. The RSI stretch is the soft spot on that push.
- Stretch check: RSI 66.0 (lean OB · 35 band). Price sat above the 50-day/100-day/200-day average(s).
- Open the live SPY chart for current reads — this sheet is a fixed snapshot (engine bar date 2026-08-07).
Descriptive if/then scenarios only — not a buy or sell recommendation.
One click to build a sheet, save it, or share it. Free to start.
Sign up free →Price map — what to watch on the chart
Daily candles to the snapshot date. Chart overlays the nearest 3 supports and 3 resistances; the S/R section below lists up to 4 per side. Top strip lists those chart levels; Y-axis shows short tags only (R1, S1, ±σ). Blue line = snapshot price.
Daily σ price band
Typical one-day up/down range from 252 days of daily log returns — same formula as the live app.
252-day historical daily vol at snapshot: 1σ ≈ 0.81% (±$6.91 on this close). 252 trading days of daily log returns → μ and σ → spot × exp(μ ± k·σ). Same engine formula as Call for Action. Historical close-to-close vol — not ATR or options implied vol.
Support & Resistance
Prices where the move has paused before. Resistance sits above price; support sits below.
Swing
Swing · all-time high · 52-week high
Swing · prior-day low
Swing
Swing · prior-month low · prior-week low
Swing
52-Week Range
Where today’s price sits between the 12-month low and high.
Regime — All Timeframes
The market “weather” on each timeframe — calm, expansion, fragile, or stressed. Timeframes can disagree.
Market Structure
Whether a real trend exists, and who is in control (buyers or sellers), on each timeframe.
Trend Persistence (1D)
Whether the daily move is likely to continue (trend) or fade (mean-revert), and which side is in control.
| Signal | Value | Read |
|---|---|---|
| Hurst | 0.50 | Random walk |
| DI+ / DI− | 30.7 / 17.4 | DI+ higher (daily bar) |
| ADX | 22.1 | Below 25 · not confirmed |
Moving Averages (1D)
Where price sits versus its 50-, 100-, and 200-day averages. Above = longer-term strength; below = weakness.
| MA | Price | Vs Spot |
|---|---|---|
| SMA 50 | 747.19 | Above +3.5% |
| SMA 100 | 723.63 | Above +6.8% |
| SMA 200 | 702.97 | Above +10.0% |
Momentum (1D)
Short-term speed of the move. RSI flags stretched conditions; MACD shows momentum building or fading.
| Signal | Value | Read |
|---|---|---|
| RSI (14) | 66.0 | lean OB · 35 band |
| MACD | 6.19 | Above signal |
| Signal / Hist | 2.85 / 3.34 | Bull widening |
Adaptive RSI Bands
1D is in transition with bullish DI, so the engine uses the 35 / 65 band (not the fixed 70/30). RSI 66.0 sits lean OB → reads as lean ob. Same adaptive logic as the live Call-for-Action tab.
- Learn how to read regime states →
Clear Skies through Full Storm — what each weather label means in practice.
- Understand Market Structure →
ADX, DI+/DI−, and Hurst — the cheat sheet behind the persistence table.
- Generate your own Asset Sheet →
Same package for any global asset — free to start.

Pick from thousands of global assets, generate a sheet in one click, download the PDF, and share your own posts.
Create your Asset Sheet →regimeintelligence.com · open Opportunity Scanner →Generated from live Regime Intelligence engine data. Descriptive context only — not a recommendation to buy or sell any security. Markets guarantee nothing. Educational use only. Not investment advice.
RI™ Asset Sheet Series · SPY · Snapshot Aug 8 2026 01:18 ET
The SPY Asset Sheet is the entire Regime Intelligence read on SPDR S&P 500 ETF Trust, on one page — built from the same engine that powers the live app. Download it, share it, keep it next to your charts.
What's inside
- Regime across all five timeframes — 15m, 1h, 4h, 1D, 1W.
- Trend & control per timeframe — ADX, DI, and Hurst.
- Support/resistance, key levels, and 50/100/200-day moving averages.
- Momentum, adaptive RSI bands, and the one-day σ price range.
This sheet is a dated snapshot (Aug 7, 2026). For the live, always-current SPY read, open it in the app.