X-RAY · XAU/USD (GOLD SPOT) · JUNE 10, 2026 · FOLLOW-UP REPORT
The Regime Intelligence Engine Called It Perfectly.
Over $300 Bagged and Counting.
It flagged $4,550–$4,602 as solid resistance. We called the 200-day break. Gold has broken below $4,200. The next target is $3,910–$3,930.
XAU/USD ~$4,180 intraday · Daily CSS 81.5% · EWS active · Storm Warning pending
Sherif Saad · Regime Intelligence · Not financial advice
EXECUTIVE SUMMARY
Our engine called it. The market delivered. The next leg is being set up now.
Regime conclusion: XAU/USD remains in Thin Ice on the daily — but the stress score has surged to 81.5%, the Early Warning Signal has activated on the 1-hour and daily timeframes, and the pending state is Storm Warning. The engine is signaling re-escalation. The weekly timeframe is already in Storm Warning at 73.4%. Bears remain in full control.
What happened: Before our June 5 article, the Regime Intelligence engine had already flagged $4,550.79–$4,602.63 as a resistance zone scored 100/100 — the highest confidence rating in the system. Price tested that zone and failed. Then on June 5 we published the XAU/USD X-Ray calling the 200-day SMA break in real time at $4,330. Gold has broken below $4,200. The move from the engine-flagged resistance zone top: over $400. Every structural level the engine identified has held as resistance. Every bounce has been sold.
The forward view: The next structural target is $3,910–$3,930 — a support zone scored 92.3/100, last tested November 2025. That is 6.2% below current price. The regime is not recovering. The daily CSS has risen from 55.4% on June 5 to 81.5% today — stress is building, not unwinding, even as the label reads Thin Ice. With EWS active on the daily and pending re-escalation to Storm Warning, the engine is telling you the next leg is being set up right now.
THE RECORD — WHAT THE ENGINE FLAGGED AND WHEN
The engine scored it 100/100. Price obeyed perfectly.
Before June 5, while most traders were still debating whether Gold's bull run had more room, the Regime Intelligence engine had already identified $4,550.79–$4,602.63 as a resistance zone with a perfect score of 100/100 — active simultaneously on the 4-hour and daily timeframes. The highest confidence rating the system produces.
That zone was not an opinion. It was a price-action level computed from the engine's structural analysis — every scoring criterion maxed out. Touch count, recency, timeframe confirmation, level quality. All of them. 100/100.
The daily chart tells the story without ambiguity. Price reached that zone. The daily wick barely kissed $4,560 before the rejection. Multiple sessions tested the zone from below and failed to close above it. Then June 5 arrived — Gold broke its 200-day SMA on a 3.24% session, closing at $4,330. Our article published the same day called it exactly: the institutional buyers who defended the 200-day for 972 days did not show up. Bears are in full control.
Days after publication, Gold is below $4,200. The 200-day SMA — which was support for 972 consecutive days — is now $275 overhead at $4,455 and declining. Every bounce has been sold. Every resistance level has held.
Engine alert — Resistance zone · Score: 100/100
$4,550.79–$4,602.63 · Price-action zone · Active on 4H and 1D · Detected before the June 5 break. Price tested the zone, failed, and has not recovered. From the top of the zone to today: −$400 and counting.
XAU/USD · Daily regime history
THE ENGINE READ — JUNE 10, 2026
Thin Ice label. 81.5% stress. EWS active. Storm Warning pending. The label is not the full picture.
This is the most important data point in this update and the one most traders will misread. The daily regime label reads Thin Ice. That sounds like moderation. It is not. The CSS on the daily is 81.5% — that is objectively Storm Warning territory by stress level, even though the label has not yet re-confirmed the transition. The pending state is Storm Warning. The Early Warning Signal is active on the daily. The engine is telling you what comes next before the label catches up.
This is the same dynamic described in the February 2026 Bitcoin case — a label reading one thing while the stress score reads another. Then the label caught up. One month later: Full Storm at 98.3%.
15m
Thin Ice
48.8%
trend z: −2.05
EWS Off
1h
Tailwind
34.8%
trend z: −2.34
EWS ON
4h
Tailwind
31.7%
trend z: −3.03
EWS Off
1d ★
Thin Ice
81.5%
trend z: −2.89
EWS ON
1w
Storm Warning
73.4%
trend z: −2.64
EWS Off
★ Primary canonical timeframe. All trend z-scores negative across every timeframe without exception. Note: daily bar regime and structural levels update after each session close. Intraday readings reflect live engine state.
TAS: 0.40 · 2 of 5 timeframes agree · WEAK ALIGNMENT · Modal state: Thin Ice · Conflict: active
The intraday Tailwind readings on 1h and 4h are not bullish confirmation. They are the signature of a technical bounce forming inside a larger stress episode — the same pattern that has appeared after every sharp leg down since June 5. The higher timeframes carry the structural truth. The weekly is already in Storm Warning. The daily CSS at 81.5% with EWS active is the engine's clearest signal that re-escalation is imminent, not recovery.
The signal most traders will miss — June 10, 2026
Daily regime label: Thin Ice. Daily CSS: 81.5%. EWS: active. Pending state: Storm Warning. A Thin Ice label with 81.5% stress and an active Early Warning Signal is not a recovery. It is the setup for the next leg. The engine flagged the exact same divergence pattern before every major stress escalation in this dataset.
| Date | Regime | CSS % | Engine read |
|---|---|---|---|
| Apr 1, 2026 | Storm Warning | 85.4% | Storm Warning confirmed. 1st bar. |
| May 1, 2026 | Storm Warning | 58.3% | Bar 23. Pending Thin Ice. De-escalation building. |
| May 6, 2026 | Thin Ice | 54.8% | Transition confirmed. Storm Warning ends at 25 bars. |
| Jun 5, 2026 | Thin Ice | 55.4% | Bar 23. 200-day breaks. Article published. $4,330. |
| Jun 9, 2026 | Thin Ice | 72.3% | Bar 25. Pending Storm Warning. Stress re-accelerating. |
| Jun 10, 2026 | Thin Ice | 81.5% | Bar 26. EWS active. Storm Warning pending. ~$4,180 intraday. |
THE ANATOMY OF A PERFECT CALL
Engine flagged the resistance. We called the break. The trend delivered.
| Date | Event | Price | Engine read |
|---|---|---|---|
| Pre–Jun 5 | Engine flags $4,550.79–$4,602.63 · Score 100/100 | ~$4,560 zone | Resistance zone · 4H + 1D · Maximum confidence |
| Jun 4 | 200-day approach alert active | $4,423 area | $4,427 proximity flagged |
| Jun 5 | 200-day breaks · −3.24% session · Article published | $4,330 | Thin Ice · 55.4% CSS · 23 bars |
| Jun 5 | $4,373 flipped support breached · Score 74/100 | $4,330 | Confirmed resistance |
| Jun 9 | CSS surges to 72.3% · Pending Storm Warning appears | $4,233 | EWS building |
| Jun 10 | EWS active on 1d · CSS 81.5% · Storm Warning pending | ~$4,180 | Over $400 below resistance zone top |
The pattern described on June 5 has executed without deviation. Institutional sellers distributing into every bounce. The flipped 200-day acting as overhead resistance. Each rally failing below the previous high. The engine called the zone. We called the trend. The market confirmed both.
THE MACRO CONTEXT — JUNE 10, 2026
The macro picture has improved since June 5. Gold is falling anyway.
Three of the five macro series have improved since the June 5 article. That improvement has not stopped Gold from falling — which tells you the selling pressure is structural, not purely macro-driven.
| Series | Regime (1d) | CSS % | Read for Gold |
|---|---|---|---|
| DXY | Clear Skies | 39.2% | Dollar stress easing — monetary headwind reduced |
| US 10Y Yield | Thin Ice | 66.3% | Rates still elevated — real rate pressure persists |
| TERM_10Y3M | Clear Skies | 69.0% | Curve calm — no acute credit signal |
| FXI Risk-Off | Tailwind | 44.1% | Safe haven demand recovering — partial Gold tailwind |
| FXI Risk-On | Tailwind | 50.6% | Risk appetite returning — reduces safe haven bid |
| FXI EM Stress | Tailwind | 48.1% | EM stress easing — global conditions improving |
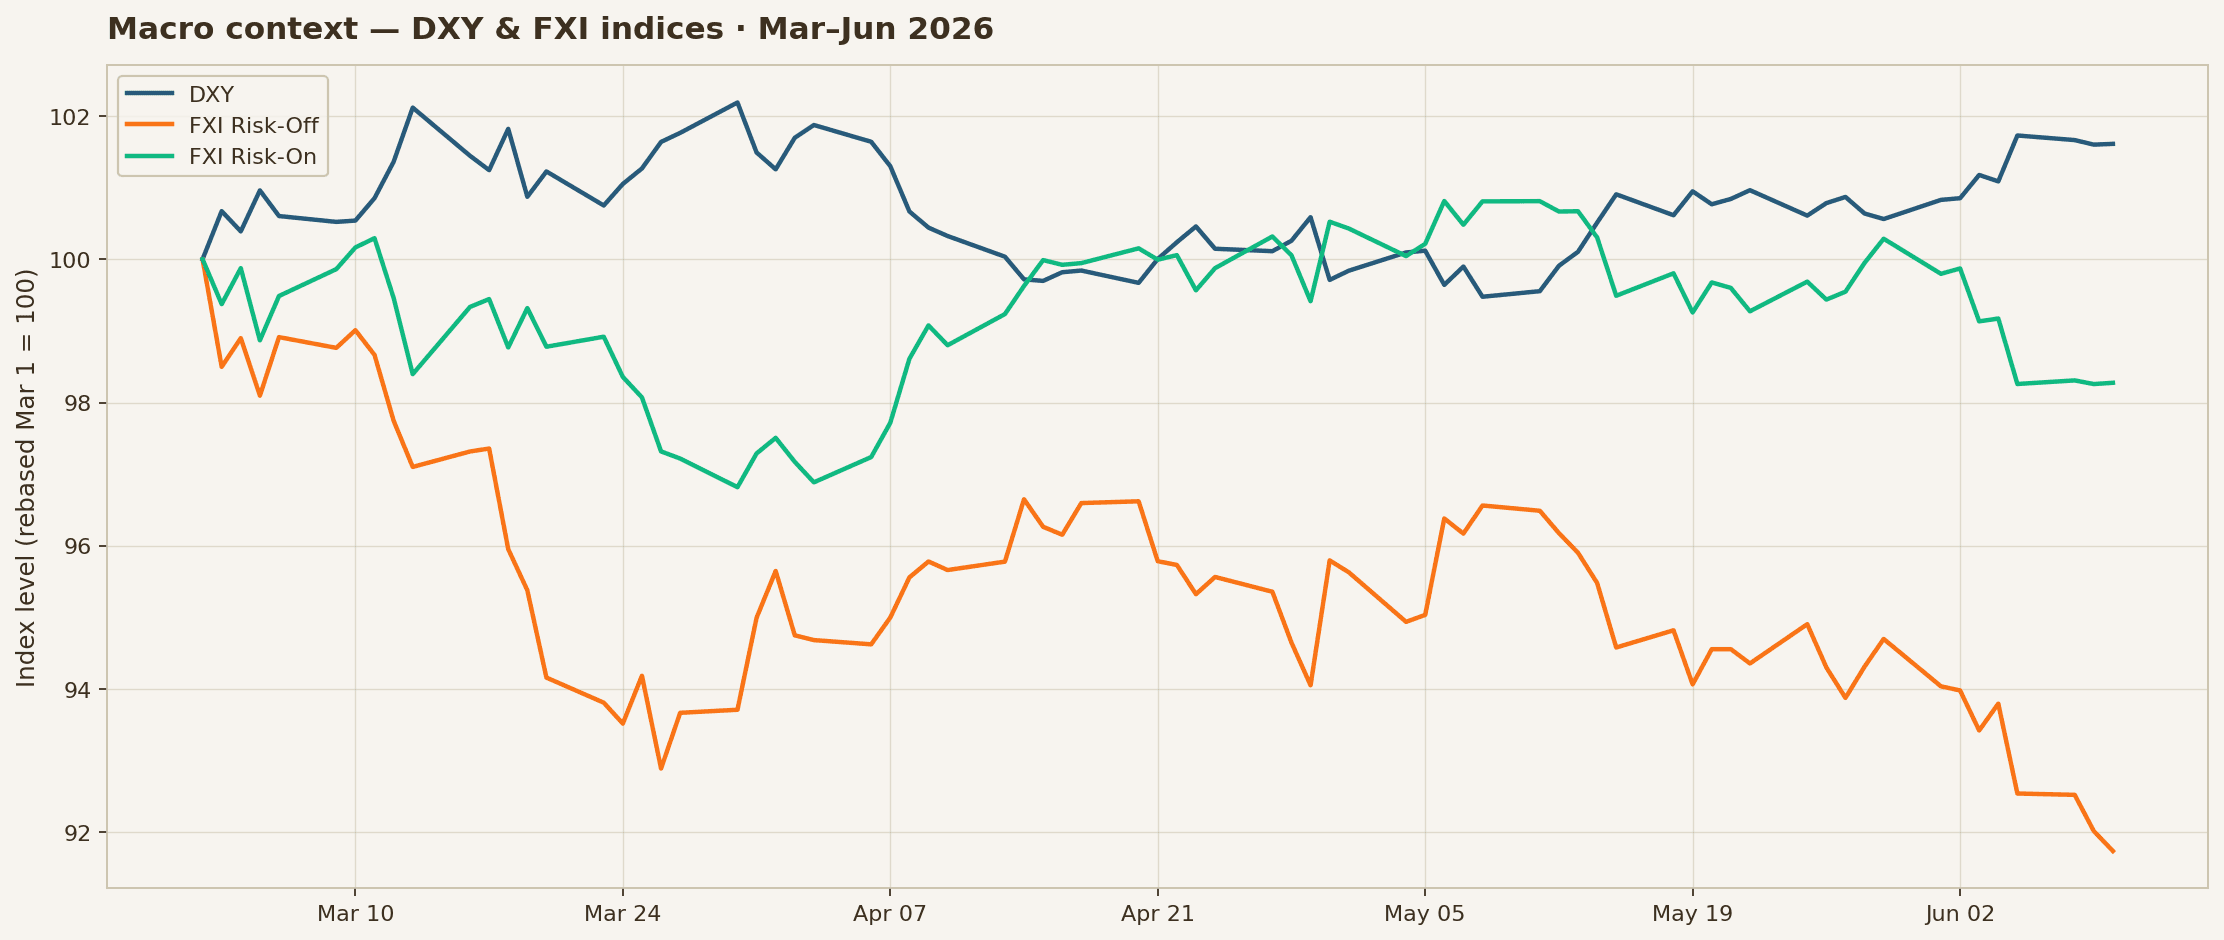
Macro context · DXY & FXI indices (Mar–Jun 2026)
The macro paradox — June 10, 2026
The macro environment is objectively less hostile to Gold than it was on June 5. DXY is in Clear Skies. All three FXI indices have recovered to Tailwind. And yet Gold has fallen over $150 since the article published — from $4,330 to below $4,200. When an asset falls through an improving macro environment, the selling is structural — not reactive. The institutional distribution that began at the $4,550–$4,602 resistance zone is not finished. The macro tailwind has not been enough to interrupt it. That is the most bearish data point in this entire update.
MY READ
The call was right. The trend is accelerating. The next target is $3,910–$3,930.
I called this on June 5. I said the institutional buyers who defended the 200-day for 972 days did not show up. I said every rally would be sold. I said this was the beginning of a sustained bearish trend.
Gold is now below $4,200. The macro has actually improved since I wrote that — dollar is calmer, FXI indices recovered. Gold is falling anyway. That is the most telling detail in this entire picture. When an asset cannot rally through improving conditions, the sellers are not reacting to news. They are executing a plan.
What I am most proud of in this call is not the direction — it is the precision. The engine flagged $4,550.79–$4,602.63 as a resistance zone scored 100/100 before I published a single word. That zone was not my opinion. It was the system identifying exactly where institutional sellers were positioned. Price arrived. They were there. The rejection was clean. From that zone to today is over $400.
The next target the engine has identified with meaningful structural significance is $3,910–$3,930 — a shelf and swing level scored 92.3/100, last tested November 2025. That is 6.2% below current price. I expect the path there to follow the same pattern we have already seen: grinding lower, relief bounces into resistance that fail, then continuation.
The one number I am watching above everything else right now is the daily CSS at 81.5% with EWS active and Storm Warning pending. That is not a recovery reading. That is the engine telling me the next leg is being set up. When Storm Warning confirms on the daily — and the pending state says it is coming — the pace of decline historically accelerates.
The one risk that could change this view
A genuine reversal in the FXI Risk-Off index — not a one-day bounce, but a confirmed regime transition toward Clear Skies. That is the quantitative signal that safe haven demand is returning. Until I see that, I remain bearish. The thesis has not changed. The market is confirming it.
THE LEVELS — JUNE 10, 2026
Where the engine sees the key zones from ~$4,180.
Current price: ~$4,180 as of June 10, 2026 02:00 UTC. ATR(1d): $72.23. Daily sigma: 1.566%. One typical large daily move: ±$66.77. Daily sigma bands anchored to 252-day historical volatility; center $4,220.81. Distances recalculated from intraday ~$4,180.
| Band | Price | Distance | Context |
|---|---|---|---|
| +3σ | $4,423.43 | +5.8%* | Near 200-day SMA — double resistance |
| +2σ | $4,357.32 | +4.2%* | Upper caution |
| +1σ | $4,291.21 | +2.7%* | First resistance zone |
| Current | ~$4,180 | — | June 10, 2026 · 02:00 UTC |
| −1σ | $4,158.99 | −0.5%* | Normal move down |
| −2σ | $4,092.89 | −2.1%* | Lower caution |
| −3σ | $4,026.78 | −3.7%* | Extreme downside |
| Type | Price | Detail | Score |
|---|---|---|---|
| Resistance | $4,602.63 | Zone top · 4H + 1D · Rejection confirmed | 100 |
| Resistance | $4,550.79 | Zone base · 4H + 1D · Score 100/100 | 100 |
| Resistance | $4,455.02 | 200-day SMA · Held 972 days · Approach alert active | — |
| Resistance | $4,359.96 | PDH + swing · 1D · Last touch Jun 9 | 76.8 |
| Resistance | $4,267.97 | Swing · 1D structural · Last touch Jun 10 | 60.1 |
| — Current — | ~$4,180 | June 10, 2026 · 02:00 UTC | — |
| Resistance | $4,236.57 | PDL · 1D · Broken · Now overhead resistance | 59.8 |
| Support | $4,173.45 | Shelf + swing · 1D · Last touch Mar 23 | 71.5 |
| Support | $4,104.69 | Shelf + swing · 1W · Last touch Mar 23 | 69.7 |
| Target | $3,910–$3,930 | Shelf + swing · 1D · Score 92.3 · Last touch Nov 2025 · −6.2% | 92.3 |
| Structural | $3,248.98 | 52-week low · Last touch Jul 2025 · −22.2% | — |
Five active approach alerts — engine in maximum proximity mode
200-SMA $4,455 from below (+4.58% / 1.95 ATR) · overhead. Structural $4,265 from below (+0.12% / 0.05 ATR) · immediate. PDL $4,236 from above (−0.55% / −0.24 ATR) · now overhead — broken. PWL $4,312 from below (+1.22% / 0.52 ATR). PML $4,367 from below (+2.51% / 1.07 ATR). The PDL at $4,236 is broken and now overhead. Next structural reference: $4,173.
TRADING IMPLICATIONS
Three trader types. One confirmed trend. Different applications.
Trend followers
The trend is confirmed and the engine is signaling acceleration. Daily CSS at 81.5% with Storm Warning pending is the regime environment trend-following systems are built to respect on the short side. The 100/100 resistance zone at $4,550–$4,602 has defined the top of this trend. The 200-day SMA at $4,455 — declining — is the secondary resistance ceiling. Neither has been challenged since the June 5 break. The trend is intact until proven otherwise.
Swing traders
The PDL at $4,236 is broken and now overhead resistance. Price has pushed below $4,200. The next confirmed structural support is $4,173 — score 100/100. The pattern since June 5 has been consistent: sharp down sessions, brief bounces into declining resistance, then continuation. The swing at $4,267 and the band at $4,291 define nearest overhead resistance.
Long-term investors
The structural target the engine has identified with a 92.3/100 score is $3,910–$3,930 — last tested November 2025. That level represents 6.2% below current price and is the first area where the engine detects meaningful structural support with genuine institutional significance.
WHAT TO WATCH — THE ENGINE'S FORWARD SIGNALS
Five specific triggers. The engine is already tracking them.
Storm Warning confirmation on the daily
The pending state is Storm Warning. The daily CSS is 81.5%. The EWS is active. When the engine confirms the transition — watch bars_in_state reset to 1 on the daily under a Storm Warning label — that is the quantitative confirmation the next leg has begun.
$4,173 — the next structural support
Score 71.5/100. Last tested March 23. The PDL at $4,236 now overhead — broken. A daily close below $4,173 with follow-through opens the path to $4,104 and then toward $3,910–$3,930.
Any rally into $4,267–$4,359 — the resistance band
The swing at $4,267 (score 60.1) and the PDH at $4,359 (score 76.8) define the overhead resistance band. A bounce that fails below $4,267 on a daily close confirms sellers remain in control.
$3,910–$3,930 — the primary target
Score 92.3/100. The highest-scored support level below current price. When price approaches this zone and the engine approach alert activates, watch for simultaneous regime de-escalation signals across multiple timeframes.
FXI Risk-Off direction
Currently Tailwind at 44.1% — recovered from Thin Ice on June 5. If FXI Risk-Off continues recovering toward Clear Skies, safe haven demand is genuinely returning. That is the one macro development most likely to interrupt the bearish trend before it reaches $3,910–$3,930.
Live Updates · Free access · regimeintelligence.com/markets/GC1