X-RAY · XAU/USD (GOLD SPOT) · JUNE 5, 2026
Two and a Half Years.
Gone in One Session.
XAU/USD Regime Analysis: What the Engine Read Before the 200-Day Break
XAU/USD close: $4,330 · Daily change: −3.24% (−145 pts) · 200-day SMA: $4,427 (now overhead)
Sherif Saad · Regime Intelligence · Not financial advice
EXECUTIVE SUMMARY
XAU/USD has entered a bearish regime. The 200-day break is confirmed and the engine agrees.
Regime conclusion: XAU/USD is in a confirmed bearish regime. The weekly timeframe is in Storm Warning. The daily entered Storm Warning on April 1 and held it for 25 consecutive bars through May 5, then de-escalated to Thin Ice on May 6 — 23 bars as of this export. The 200-day SMA, which held as support for 972 consecutive days, broke decisively on June 5, closing $97 below it. Bears are in full control. The bearish structure is intact; the stress on the daily is compressing, not gone.
What is driving it: Trend pressure is uniformly negative across all five timeframes simultaneously — a rare condition that signals broad-based directional conviction to the downside. Rising 10-year yields, dollar strength, and weakening safe haven demand have removed the macro tailwinds that supported Gold's multi-year bull run.
My expectation: I am extremely bearish on XAU/USD from current levels. I expect this to be the beginning of a sustained bearish trend with the 52-week low at $3,255.98 as the natural technical target, absent an exogenous catalyst that fundamentally changes the macro picture.
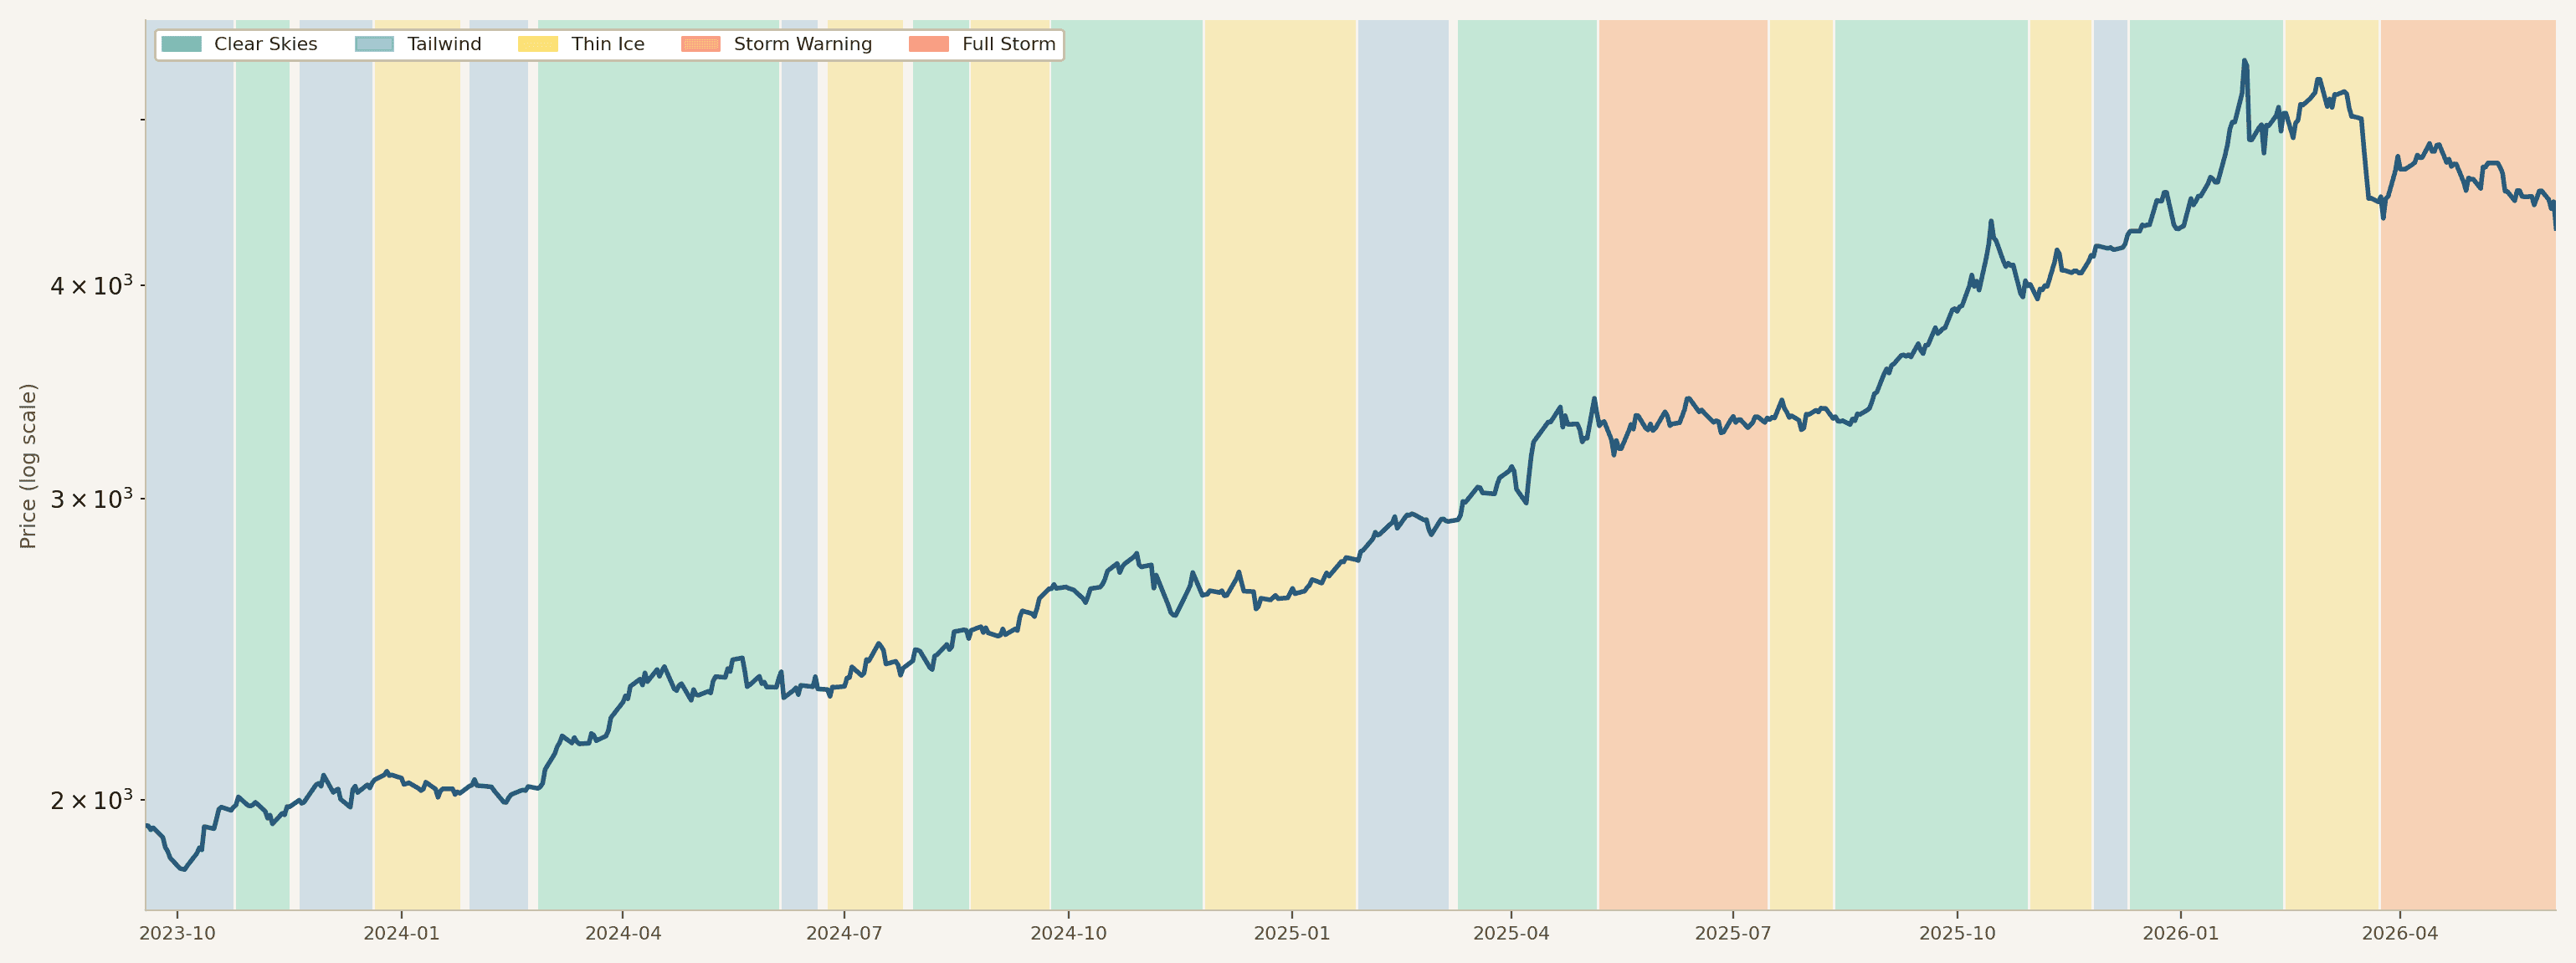
THE EVENT
Gold just broke a 972-day trend. This is not a dip.
XAU/USD closed at $4,330 on June 5, 2026 — down $145, or 3.24%, from the prior session close of $4,475. Gold closed firmly below its 200-day simple moving average at $4,427 for the first time since October 2023. Not a pierce. Not an intraday wick. A clean close, $97 below the 200-day, on a 3.24% down session.
The 200-day moving average had held as support through the entire bull run that took XAU/USD from $1,930 to an all-time high of $5,597.23. Every institutional algorithm, every trend-following fund, every long-term allocator uses that level as a reference. For 972 consecutive days, every test of that level was bought. Today it was not.
When a level that has held for nearly three years breaks on heavy selling, that is not noise. That is information. The Regime Intelligence engine had been reading elevated stress on the daily since April 1 — twenty-five consecutive Storm Warning bars through May 5 — before de-escalating to Thin Ice on May 6. Today's 200-day break arrived with the weekly still in Storm Warning and trend pressure negative on every timeframe.
Engine alert — Support under attack · Alert score: 100/100
Support at $4,373.22 on the 4-hour chart. First 4h close below this level: June 5, 2026, at 12:00 UTC. Close at $4,335.78. Classification: provisional breach. Active across 15M, 1H, and 4H timeframes. Level score: 74/100. The daily close at $4,330 removed all doubt.
Engine alert — Approaching 200-day SMA · Distance: 2.19% below
Condition first true: June 4, 2026, daily close. XAU/USD was already approaching the 200-day SMA at $4,423 the session before the break. As of the June 5 20:00 UTC export, price is $97 below the 200-day. The level that was support for 972 days is now overhead resistance.
THE ENGINE READ — JUNE 5, 2026 · 20:00 UTC
Five weeks in Storm Warning, then Thin Ice. The weekly never de-escalated.
The regime classification on the daily timeframe entered Storm Warning on April 1, 2026 — 25 consecutive bars ending May 5. The engine then de-escalated to Thin Ice on May 6, where it remains as of publication — 23 bars and counting. The bearish structure is intact. The stress is not gone — it is compressing.
The weekly timeframe tells the longer story. It entered Storm Warning on June 1 and had not de-escalated as of the June 5 export. Thin Ice on the daily is not a clean bill of health — it is compressed stress with uniformly negative trend z-scores across all five timeframes simultaneously.
XAU/USD · Daily regime history
15m
Thin Ice
63.3%
trend z: −2.73
1h
Tailwind
51.2%
trend z: −2.59
4h
Clear Skies
32.2%
trend z: −3.02
1d ★
Thin Ice
55.4%
trend z: −3.19
1w
Storm Warning
77.9%
trend z: −3.07
Timeframe agreement: TAS 0.40 · Only 2 of 5 timeframes agree · WEAK ALIGNMENT · Modal state: FRAGILE
What is driving the regime — trend z-scores
Every single timeframe shows a deeply negative trend z-score. There is not one timeframe where trend pressure is neutral or positive. When all five timeframes agree on the direction of trend pressure simultaneously, and that direction is strongly negative, the signal is high conviction.
★ Primary canonical timeframe. Trend z-scores shown below each CSS reading. All negative across every timeframe.
THE MOMENTUM PARADOX — WHY MOST TRADERS WILL MISREAD THIS
The momentum readings look bullish. They are not. Here is why.
This is the most dangerous data point in the entire XAU/USD picture right now. Long momentum percentile readings on the intraday and daily timeframes are at historically extreme levels: 4h at the 0.4th percentile, 1h at the 1.2th percentile, 1d at the 1.2th percentile. A trader who screens for momentum without regime context reads these as extreme bullish momentum. That conclusion is wrong in this environment.
Regime context reverses the surface read
Momentum measures the velocity of price movement, not its direction in the way most traders assume. In a sharply declining market, momentum readings compress to historically extreme levels because the market is moving fast — in the wrong direction. The regime is the context that tells you which way that velocity is pointed.
| Timeframe | Long momentum | Momentum %ile | Trend z-score | Read |
|---|---|---|---|---|
| 15m | +0.83 | 10th | −3.00 | Fast decline |
| 1h | +0.81 | 1.2th | −2.61 | Fast decline |
| 4h | +0.87 | 0.4th | −3.03 | Fast decline |
| 1d ★ | +0.84 | 1.2th | −2.90 | Fast decline |
| 1w | +0.83 | 73rd | −2.67 | Sustained down |
THE MACRO CONTEXT — THREE MONTHS OF BUILDING PRESSURE
The 200-day break did not happen in isolation. The macro was building this for months.
| Series | Mar 6, 2026 | Jun 5, 2026 | Change & implication |
|---|---|---|---|
| 10Y yield | 4.15% | 4.49% | +34 bps — rising real rates pressure XAU/USD |
| 10Y−3M spread | 0.46% | 0.71% | +25 bps — curve steepening, long-end risk rising |
| DXY | 98.85 | 100.05 | +1.2% — dollar strength is a direct headwind |
| FXI Risk-Off | 133.39 | 124.63 | −6.6% — safe haven demand weakening |
| FXI Risk-On | 97.91 | 96.67 | −1.3% — risk appetite fragile |
| FXI EM Stress | 143.32 | 142.59 | −0.5% — EM stress contained but elevated |
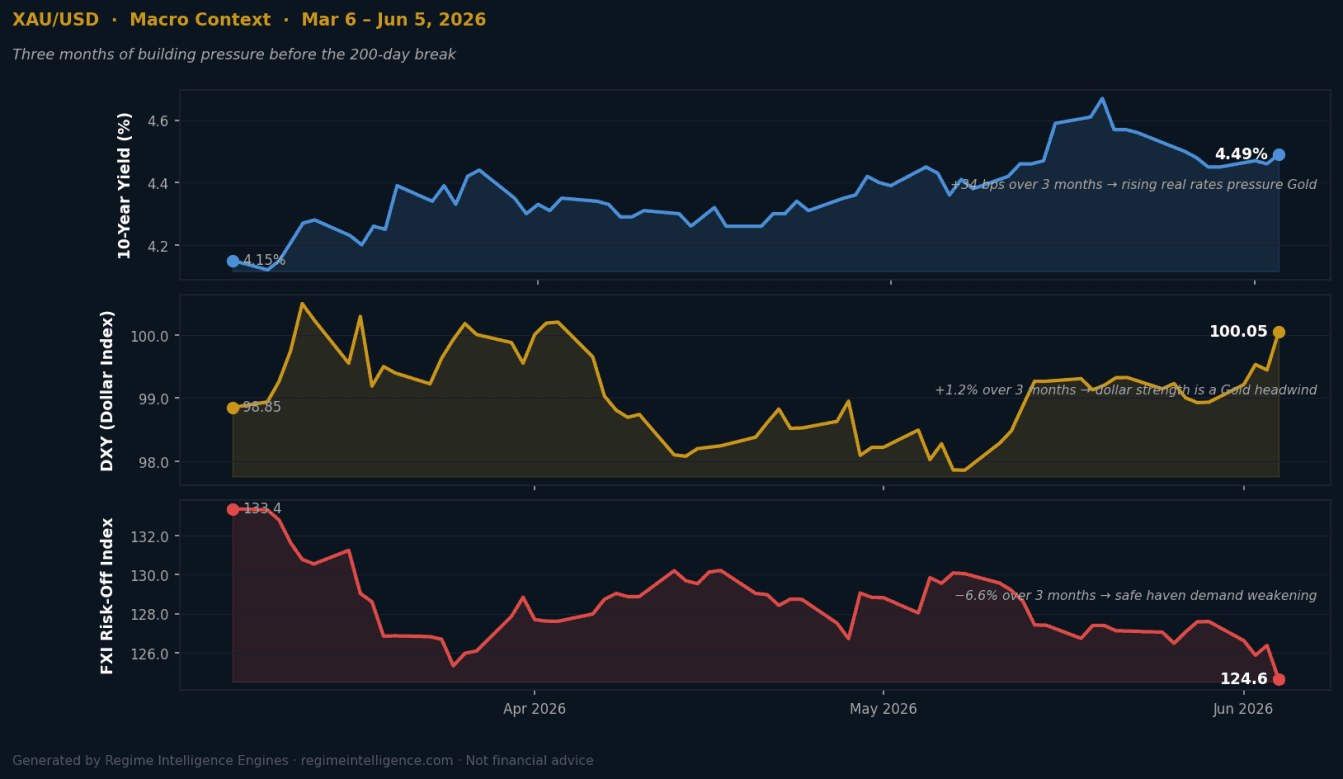
Macro context · yields, dollar, and FXI indices (Mar–Jun 2026)
FXI Risk-Off falling while Gold stress persists on the weekly
Risk-off assets — the hedges and safe havens — have been losing their safe haven premium. Gold is supposed to benefit when risk-off demand rises. Instead, both risk-on and risk-off indices have deteriorated simultaneously. Rising yields and dollar strength created the structural pressure over three months. The daily label compressed to Thin Ice on May 6; the weekly remained in Storm Warning. The 200-day break on June 5 was the market releasing that accumulated pressure in a single session.
MY READ
I am extremely bearish on XAU/USD. Here is exactly why.
The balance of power in Gold right now screams bears are in full control. The 200-day break on a 3.24% session, closing $97 below the level rather than wicking through and recovering, tells you that the institutional buyers who defended that level at every previous test over 972 days did not show up today. When that quality of buyers disappears, it is not a one-day event. It is a regime change.
Technical target
I expect this to be the beginning of a strong bearish trend. The natural technical target, absent any exogenous catalyst that changes the fundamental picture, is the 52-week low at $3,255.98 — a 24.7% decline from current levels. I expect the path there to be volatile, with relief rallies that look convincing but fail at resistance.
The 200-day SMA at $4,427 is now overhead resistance. The flipped support at $4,373 — which the engine flagged with an alert score of 100/100 — will be another line of resistance below the 200-day. A failure to reclaim it on any bounce confirms the break.
The one risk that could invalidate this view
Exogenous catalysts: a major geopolitical shock, a sudden shift in Federal Reserve communication, or a systemic financial event could reverse this picture rapidly. I am watching the FXI Risk-Off index specifically — if it reverses and begins recovering, that is the first quantitative signal the macro environment is changing in a way that would cause me to reassess the bearish case.
THE LEVELS — ENGINE-COMPUTED STRUCTURE
Where the engine sees the key zones from $4,330.
All levels computed by the Regime Intelligence engine from XAU/USD price and volatility data. Current price $4,330 as of June 5, 2026 market close. One typical large daily move = ±$71.60.
| Band | Price | Distance from $4,330 | Context |
|---|---|---|---|
| +3σ | $4,523.45 | +4.5% | Extreme upside |
| +2σ | $4,456.32 | +2.9% | Upper caution — near 200-day SMA |
| +1σ | $4,389.20 | +1.4% | First resistance zone |
| Current | $4,330 | — | Jun 5, 2026 market close |
| −1σ | $4,254.95 | −1.7% | Normal move down |
| −2σ | $4,187.83 | −3.3% | Lower caution — watch for pause |
| −3σ | $4,120.71 | −4.8% | Extreme downside |
| Type | Price | Detail | Score |
|---|---|---|---|
| Resistance | $4,427 | 200-day SMA · Held 972 days · Now overhead after Jun 5 break | — |
| Resistance | $4,373 | Flipped prior support · Breached Jun 5 12:00 UTC | 74 |
| Resistance | $4,481 | Prior day high · Structural | 60 |
| — Current — | $4,330 | Market close Jun 5, 2026 | — |
| Support | $4,310 | PDL/swing · 1w structural · Engine approach alert active | 77 |
| Support | $4,254 | Lower −1σ band · Next natural pause zone | — |
| Support | $4,187 | Lower −2σ band · Caution zone | — |
| Support | $4,099 | Daily low March 23, 2026 | — |
| Support | $3,915–30 | Support zone, October–November 2025 | — |
| Target | $3,255 | 52-week low · −24.7% from current price | — |
TRADING IMPLICATIONS
What this regime read means depends entirely on how you trade.
The regime engine does not give trade recommendations. What follows are implications for three different types of traders — not instructions.
Trend followers
Current conditions have shifted decisively against long positions. A weekly Storm Warning regime, a daily Thin Ice read that only de-escalated after 25 Storm Warning bars, and uniformly negative trend z-scores across all five timeframes — that is the environment trend-following systems are designed to avoid on the long side.
Swing traders
A relief bounce is possible in the near term. However, the flipped resistance at $4,373 and the 200-day at $4,427 are formidable overhead levels. Fading rallies into those resistance levels is the setup this regime suggests — not chasing the decline after a 3.24% single-day move.
Long-term investors
The structural bull case for Gold has not changed with one session. But the 200-day break is a signal that deserves respect. Watch whether $4,310 structural support holds on a daily close basis.
WHAT TO WATCH — THE ENGINE'S FORWARD SIGNALS
Four specific triggers that will confirm or change the picture.
Daily close below $4,310 with follow-through
The nearest structural support is $4,310 — PDL/swing, 1-week structural, engine score 77. A daily close below this level with follow-through would confirm trend continuation.
Failure to reclaim $4,373 on any rally
The flipped support at $4,373 is now resistance with a score of 74/100. A failure to close above it on a bounce confirms the bear case.
EWS activation on the daily timeframe
EWS is currently active only on the 15-minute timeframe. Daily EWS activation, or a re-escalation from Thin Ice back to Storm Warning on the daily, would signal stress is accelerating at the most important time horizon.
FXI Risk-Off index direction
A genuine recovery in risk-off demand is the one development most likely to invalidate the bearish trend before it reaches the $3,255 target.
Live Updates · Free access · regimeintelligence.com/markets/GC1