X-RAY · XAG/USD (SILVER SPOT) · JUNE 7, 2026
Three and a Half Years.
Six Cents of Separation.
XAG/USD Regime Analysis: The 200-Day SMA Decision Point
Silver closed at $67.58. The 200-day moving average is at $67.60. A level held since November 2022 is now under direct assault. The engine entered CRISIS 30 bars ago. The next move decides everything.
XAG/USD close: $67.58 · 200-day SMA: $67.60 · ATH: $121.58 (Jan 28, 2026) · Drawdown: −44%
Sherif Saad · Regime Intelligence · Not financial advice
Key terms in this report
- CSS (Stress Score)— Composite stress percentile (0–100%) from volatility, trend, drawdown, credit, and rates vs the asset's own history. Higher = more stressed.
- EWS (Early Warning Signal) — Fires when stress is accelerating faster than the regime label has reclassified (high EVS while still in Clear Skies, Tailwind, or Thin Ice).
- TAS (Timeframe Agreement Score) — Share of the five canonical timeframes (15m, 1h, 4h, 1d, 1w) sharing the same modal regime. Low TAS = conflicting reads across timeframes.
- DXY — US Dollar Index. Strength tends to pressure dollar-priced commodities like silver.
- FXI Risk-On / Risk-Off / EM Stress— Regime Intelligence proprietary macro indices measuring global risk appetite and emerging-market stress (relevant to silver's industrial demand).
- SMA200 — 200-day simple moving average. Widely watched trend reference for institutions.
EXECUTIVE SUMMARY
Silver is at the most important technical level it has seen in three and a half years. The regime engine is watching and so should you.
Where we are: XAG/USD closed at $67.58 on June 6, 2026 — six cents above the 200-day SMA at $67.60. This level has held continuously since November 2022. The daily regime has been in Full Storm (CRISIS) for 30 consecutive bars, triggered on April 24 by a tail crash override. The engine is now pending a transition to Thin Ice — de-escalating from the crisis peak — but that de-escalation is arriving at precisely the most dangerous technical moment.
What makes silver different: Unlike Gold, which is a purely monetary asset, Silver has a dual identity. Roughly half of silver demand is industrial — solar panels, EVs, semiconductors, medical equipment. When industrial demand weakens simultaneously with monetary safe haven demand, silver faces a double headwind that gold does not. Both are pressing now.
My read: I am watching, not yet calling. The 200-day SMA is the fulcrum. The price action over the next few sessions will determine whether this is a bearish break, a sideways consolidation, or the beginning of a recovery. The engine data tells me what to watch for. Here it is.
THE SETUP — WHAT HAPPENED AND WHY IT MATTERS
Silver held the 200-day for 1,314 days. It is now testing it with six cents of separation.
Silver spot (XAG/USD) has been in a continuous uptrend above the 200-day simple moving average since November 2022. That is 1,314 calendar days of the 200-day acting as a structural floor. Every significant pullback in that period — and there were several — was absorbed above that level. Institutional trend-following models, systematic macro funds, and long-term commodity allocators all calibrated their exposure against it.
On June 6, 2026, silver closed at $67.58. The 200-day moving average closed at $67.60. Six cents of separation. Not a decisive break. Not a clean hold. A decision point. The kind of technical moment that defines the next several months of price action.
To understand why this matters, consider what happened on the way here. Silver made an all-time high of $121.58 on January 28, 2026 — less than five months ago. From that peak to the current close is a decline of $54, or 44.4%. The engine entered Full Storm (CRISIS) regime on April 24, triggered by a tail crash override when the speed and depth of the decline crossed thresholds that normal stress measurement does not capture. The crash flag is what confirmed it — not the CSS percentile alone.
The crisis nobody noticed — silver entered Full Storm on April 24, 2026
On April 1, CSS was 90.4% — in the CRISIS reference band — but the state machine held STRESS with CRISIS pending. The Barra confirmation gate had not cleared. Twenty-three trading days later, on April 24, a tail_flag_crash override fired and the engine entered CRISIS at CSS 71.0%. The crash override bypasses the normal confirmation gates because it measures something different: the rate and depth of the collapse, not just the stress level. Silver had been in Full Storm for 30 days before most traders noticed anything unusual.
Two active breach alerts from June 4
Support at $69.86 (score 81.7) and $73.04 (score 78.9) were both provisionally breached on June 4. Both to the downside. These were the structural levels that gave way before price reached the 200-day. The levels above are broken. The 200-day is the last line of structural support with any institutional significance.
XAG/USD · 18-month daily regime history
THE ENGINE READ — JUNE 5, 2026 · 20:00 UTC
Full Storm on the daily. Clear Skies on the intraday. The most conflicted timeframe picture in this series.
The five-timeframe regime strip for XAG/USD is the most internally conflicted reading across all three assets we have analyzed. The daily is in Full Storm. The intraday is in Tailwind and Clear Skies. EWS is firing on the three short timeframes but silent on the daily and weekly. TAS is 0.40 — only 2 of 5 timeframes agree, modal state CALM, full conflict flagged. This is not a simple bear signal. This is a market at maximum uncertainty.
15m
Tailwind
47.9%
EWS active
1h
Clear Skies
41.5%
EWS active
4h
Clear Skies
31.4%
EWS active
1d ★
Full Storm
59.6%
EWS off
1w
Storm Warning
36.2%
EWS off
Timeframe agreement: TAS 0.40 · 2 of 5 agree · WEAK ALIGNMENT · Modal state: CALM · Conflict: active
What the EWS pattern on the intraday means right now
EWS firing on 15m, 1h, and 4h while the daily EWS is silent is the early warning configuration for a decision point. The intraday timeframes are detecting stress escalation velocity above their thresholds while the daily regime is already confirmed in Full Storm and beginning to de-escalate. This pattern means the next move is being decided in real time on the short timeframes.
The intraday calm is not bullish confirmation. It is the surface behavior of a market that sold off violently over the past 30 days and is now pausing at a critical level. The daily Full Storm classification tells you the structural damage is real. The intraday Clear Skies tells you the acute selling pressure has temporarily abated. These two readings are not contradictory — they are sequential.
| Date | Regime | CSS %ile | EWS (1d) | Engine read |
|---|---|---|---|---|
| Jan 1, 2025 | Tailwind | 45.4% | Off | Recovery from 2024 lows. Moderate stress. |
| Apr 1, 2025 | Clear Skies | 6.9% | Off | Genuine calm. Bull trend intact. |
| Jul 1, 2025 | Thin Ice | 49.3% | Off | First stress signs. Pending Tailwind. |
| Oct 1, 2025 | Clear Skies | 0.2% | Off | Near-zero stress. ATH approach begins. |
| Jan 1, 2026 | Clear Skies | 35.3% | Active | EWS fires. ATH set Jan 28 at $121.58. |
| Mar 1, 2026 | Thin Ice | 61.2% | Off | Stress building. 44% decline begins. |
| Apr 1, 2026 | Storm Warning | 90.4% | Off | CSS in crisis band. CRISIS pending. Not yet confirmed. |
| Apr 24, 2026 | Full Storm | 71.0% | Off | Tail crash override fires. CRISIS confirmed. |
| May 1, 2026 | Full Storm | 67.1% | Off | 30-bar CRISIS episode. Pending Thin Ice. |
| Jun 5, 2026 | Full Storm | 59.6% | Off | De-escalating. Price touching 200-day SMA. |
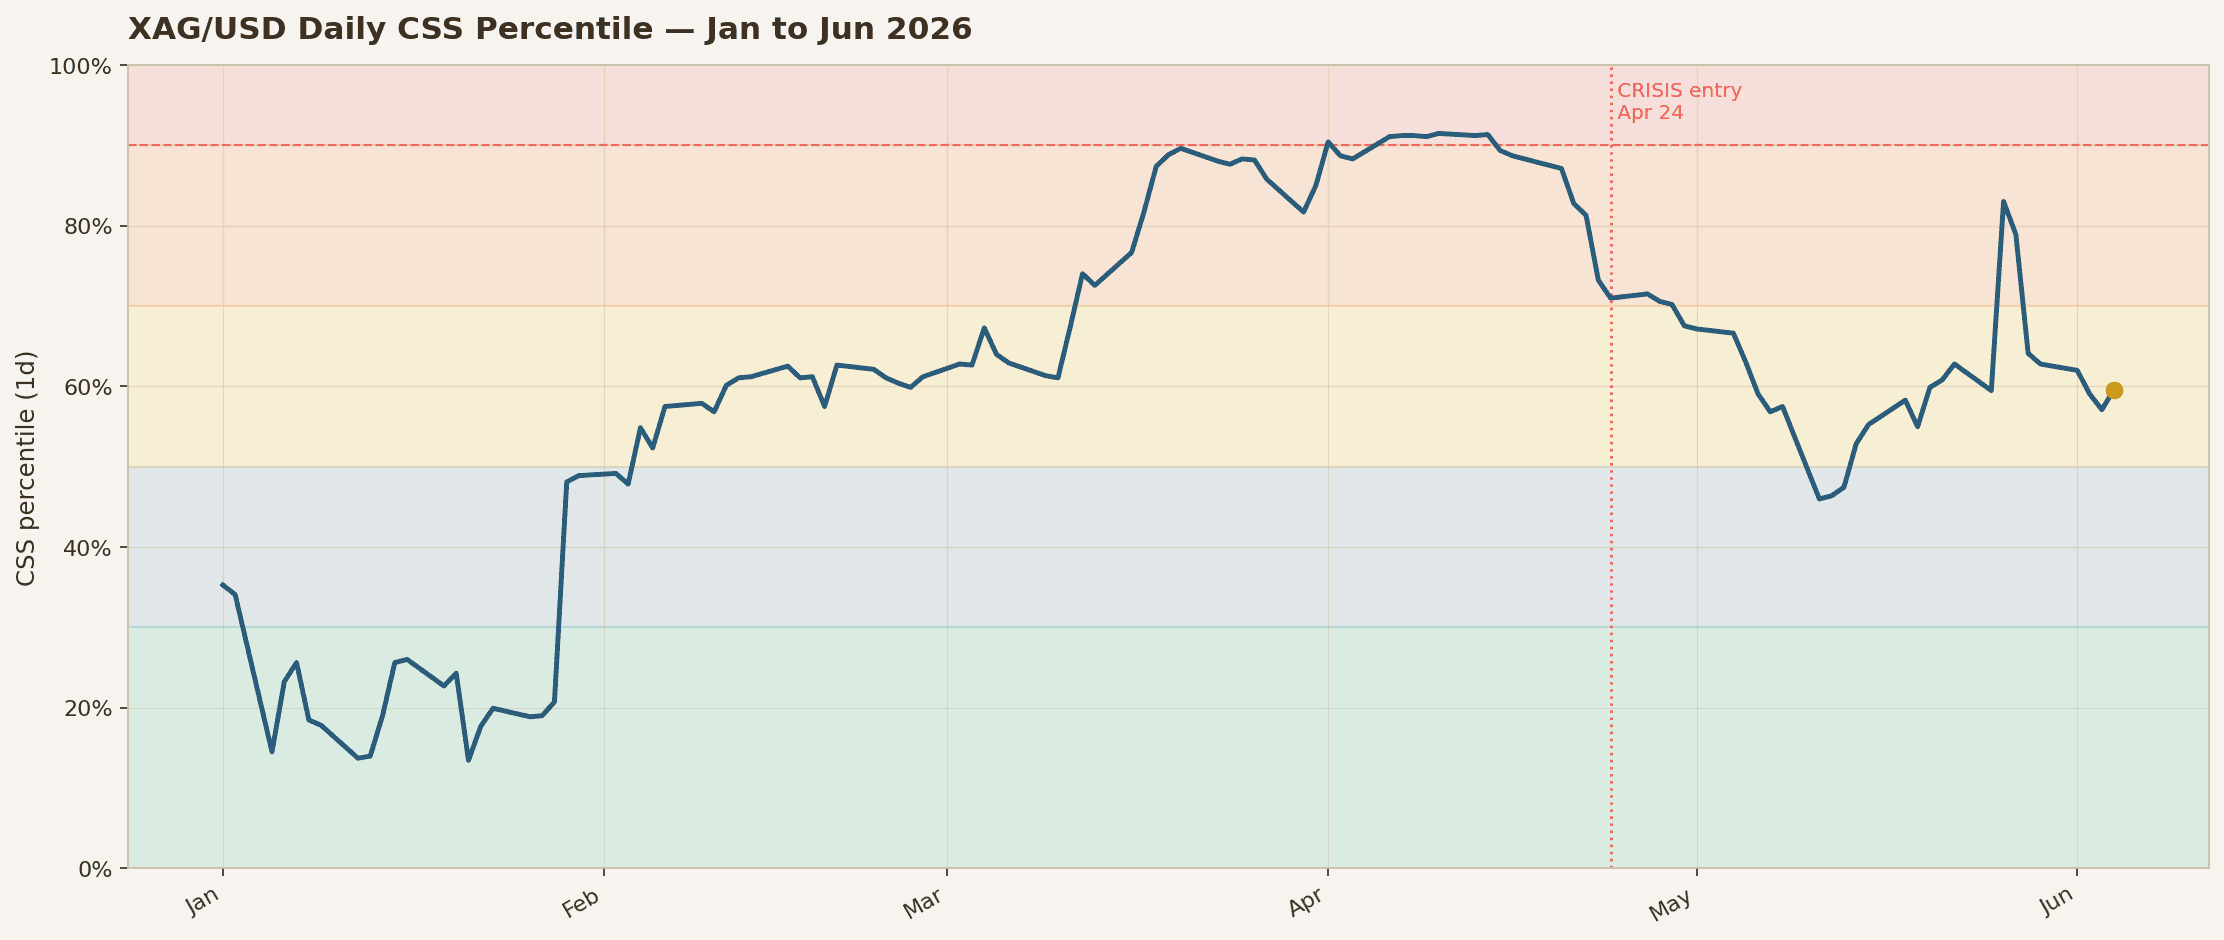
XAG/USD Daily CSS Percentile — Jan to Jun 2026
Regime labels (Clear Skies, Tailwind, Thin Ice, Storm Warning, Full Storm) map to CSS percentile bands. Full Storm can also trigger from crash overrides when decline speed exceeds normal stress gates.
WHY SILVER IS DIFFERENT FROM GOLD
Same macro headwinds. Different demand structure. More complex story.
When gold broke its 200-day on June 5, the analysis was relatively straightforward: monetary safe haven demand weakening under dollar strength and rising real rates. Silver faces the same macro headwinds. But silver has an additional demand pillar that gold does not — and that pillar is now also under pressure.
Approximately half of global silver demand comes from industrial applications: solar photovoltaic panels, electric vehicles, semiconductor manufacturing, medical equipment, and electronic components. Silver is not just a monetary metal. It is an industrial input. When monetary demand and industrial demand weaken simultaneously, silver faces a double headwind that gold never experiences.
| Factor | Gold (XAU/USD) | Silver (XAG/USD) |
|---|---|---|
| Monetary demand | Primary driver | Approx. 50% of total demand |
| Industrial demand | Minimal | Approx. 50% — solar, EVs, semis, medical |
| DXY headwind | Direct | Direct — same as gold |
| Rising yields | Direct monetary headwind | Monetary + industrial (slows EM capex) |
| EM stress impact | Indirect via risk appetite | Direct via industrial demand destruction |
| Recovery upside | Monetary re-rating only | Monetary + industrial re-rating both |
| Downside if break confirmed | Significant | Potentially more severe — dual headwind |
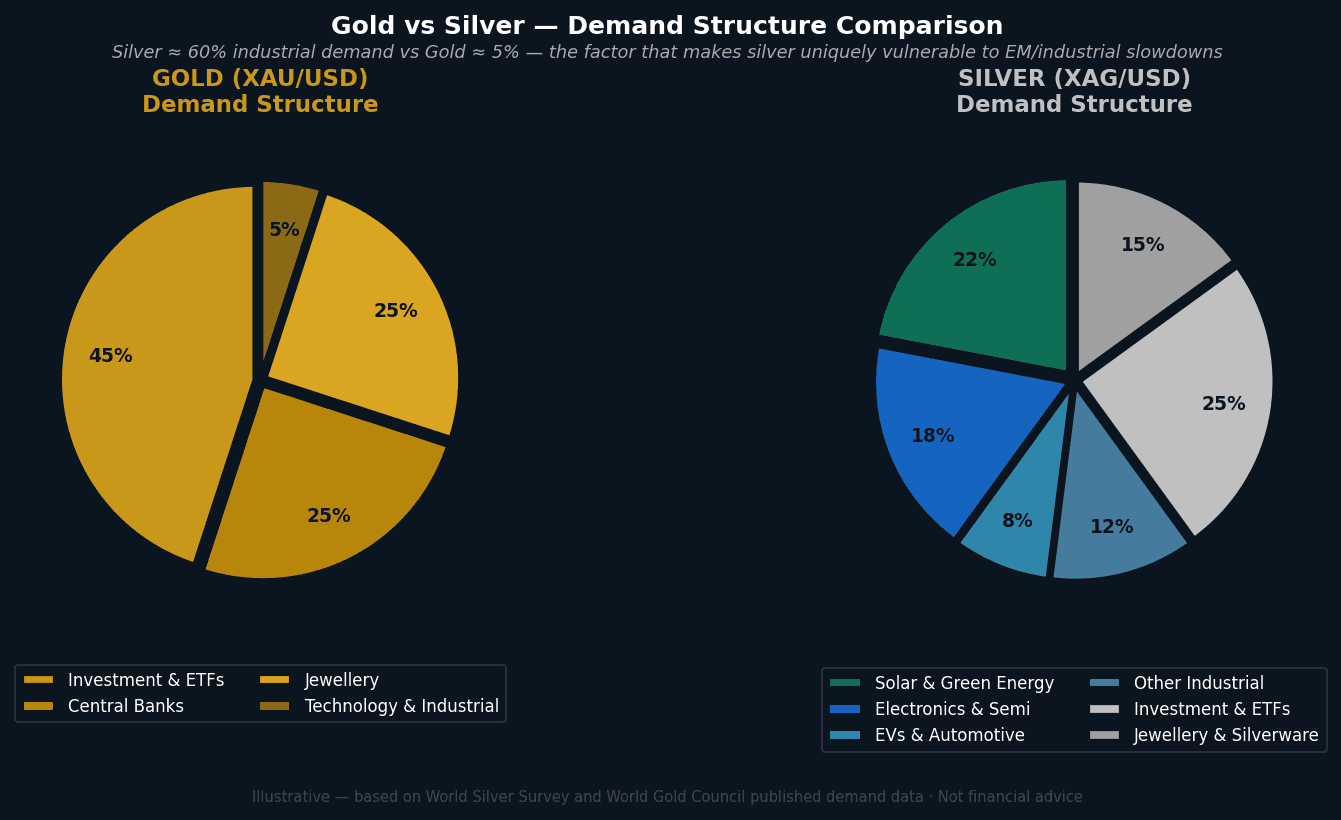
Gold vs Silver — Demand Structure Comparison
THE MACRO CONTEXT — JUNE 7, 2026
The dollar is calming. Risk appetite is recovering. But the industrial demand picture remains stressed.
The macro picture for silver is more nuanced than it was for gold on June 5. Some of the headwinds are easing. Others remain. Understanding which is which determines whether a 200-day break, if it comes, would be a structural bear trend or a temporary dislocation with recovery potential.
| Series | Regime (1d) | CSS %ile | Read for silver |
|---|---|---|---|
| DXY (US Dollar) | Clear Skies | 21.6% | Dollar stress easing. Monetary headwind reducing. |
| US 10Y Yield | Thin Ice | 56.7% | Rates still elevated. Real rate pressure persists. |
| FXI Risk-Off | Thin Ice | 35.8% | Safe haven demand fragile but recovering. |
| FXI Risk-On | Tailwind | 40.8% | Risk appetite recovering — positive for silver. |
| FXI EM Stress | Storm Warning | 28.8% | EM stress elevated — industrial demand at risk. |
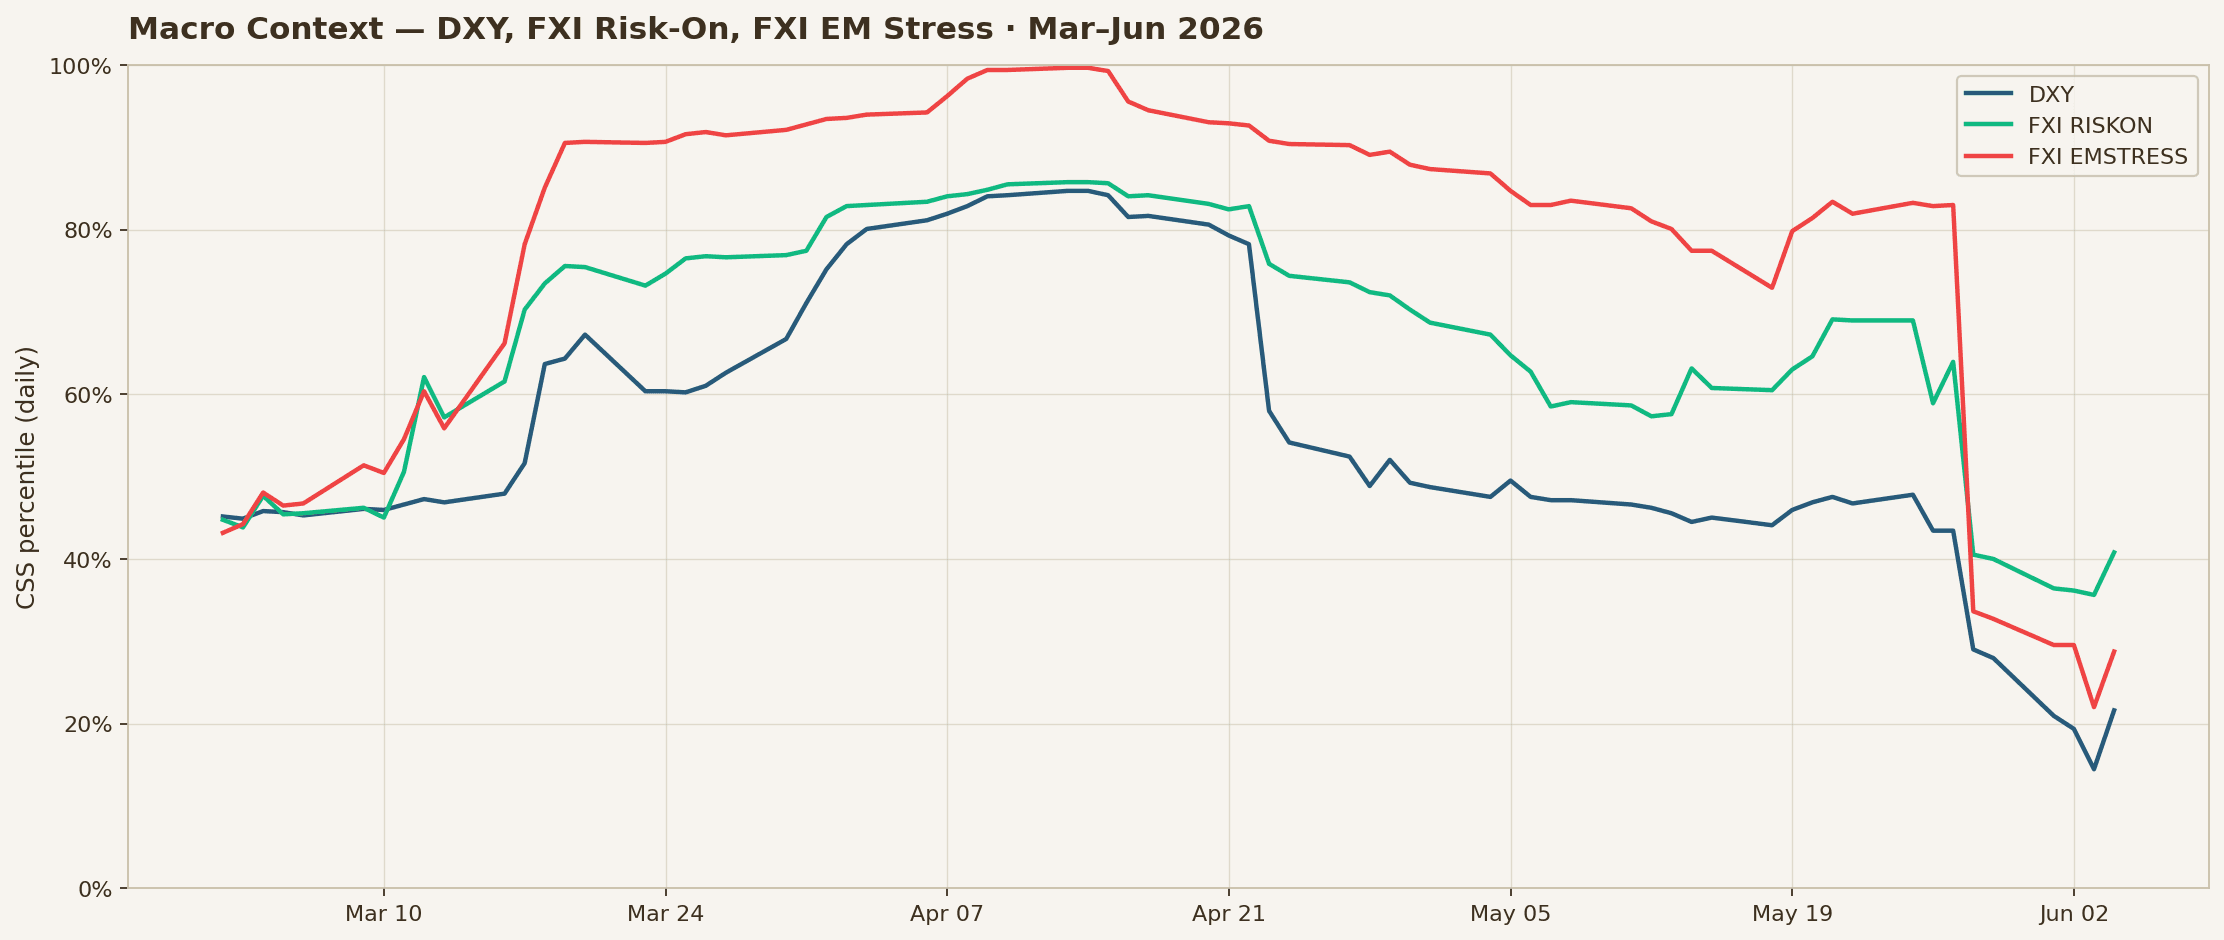
Macro Context — DXY, FXI Risk-On, FXI EM Stress · Mar–Jun 2026
Chart shows CSS percentile (stress rank), not raw index price levels. FXI_EMSTRESS is the macro series most specific to silver's industrial demand channel.
The key difference from gold on June 5
When Gold broke its 200-day, DXY was strengthening and FXI_RISKON was in Thin Ice. Today, for Silver, DXY is in Clear Skies at 21.6% CSS and FXI_RISKON is in Tailwind at 40.8%. The macro environment is less uniformly hostile than it was for Gold. That is why Silver is testing the 200-day but has not yet broken it.
MY READ
I am watching, not calling. But I know exactly what I am watching for.
The 200-day SMA at $67.60 is the most important level for XAG/USD in three and a half years. Six cents of separation is not a margin. It is a test. Unlike the Gold situation — where the break was decisive — this situation is genuinely uncertain. I will not manufacture conviction where I do not have it.
A 44% decline from the January 28 ATH of $121.58. Thirty consecutive daily bars in Full Storm regime, triggered by a tail crash override on April 24. Two structural supports breached on June 4 at $69.86 and $73.04. Price sitting at the 200-day with virtually no buffer. The bears have been in control of this market since late January.
The one number I am watching above all others
FXI_EMSTRESS. Currently Storm Warning at 28.8% CSS on the daily. If this index moves back toward Thin Ice or below, it signals that industrial demand conditions for silver are stabilizing. That is the macro confirmation I need to shift from watching to forming a directional view. Until then, the 200-day test is the only frame that matters.
THE LEVELS — ENGINE-COMPUTED STRUCTURE
Where the engine sees the key zones from $67.58.
All levels computed by the Regime Intelligence engine from XAG/USD price and volatility data. Current price $67.58 as of June 6, 2026 market close. Sigma bands anchored to 252-day historical daily volatility (σ = 3.77% daily).
| Band | Price | Distance from $67.58 | Context |
|---|---|---|---|
| +3σ | $76.02 | +12.5% | Extreme upside |
| +2σ | $73.45 | +8.7% | Upper caution |
| +1σ | $70.88 | +4.9% | Normal move up |
| Current | $67.58 | — | Jun 6, 2026 close · 200-day at $67.60 |
| −1σ | $65.74 | −2.7% | Normal move down |
| −2σ | $63.17 | −6.5% | Lower caution |
| −3σ | $60.60 | −10.3% | Extreme downside |
| Type | Price | Detail | Score |
|---|---|---|---|
| Resistance | $70.78 | Swing · Intraday · +3.99% · Last touch Jun 5 | 43 |
| Resistance | $69.86 | Structural · BREACHED Jun 4 (provisional) · Now resistance | 82 |
| Resistance | $69.25 | Swing · +1.74% · First overhead level | 26 |
| — 200-day — | $67.60 | 200-day SMA · Held since Nov 2022 · Approach alert active | — |
| — Current — | $67.58 | Market close Jun 6, 2026 · 6 cents below SMA | — |
| Support | $67.79 | PDL/swing · −0.40% · Last touch Jun 4 | 87 |
| Support | $66.85 | Swing · −1.78% · Last touch Apr 29 | 86 |
| Support | $65.87 | Swing · −3.22% · Highest score in structure | 92 |
| Extreme | $60.60 | −3σ band · Extreme downside sigma level | — |
Five active approach alerts — engine in maximum proximity mode
SMA200 at $67.54 from above (−0.76%), PDL at $67.86 from above (−0.30%), STRUCTURAL at $67.86 from above (−0.30%), PWL at $71.80 from below (+5.49%), PML at $71.80 from below (+5.49%). Five simultaneous approach alerts signal that price is compressed between multiple critical reference levels simultaneously.
TRADING IMPLICATIONS
Three different traders. Three different reads on the same setup.
Trend followers
The 200-day SMA is the trend system's primary reference. The 30-bar CRISIS classification on the daily tells you the trend environment has fundamentally changed from the bull run that took silver to $121.58. A confirmed daily close below $67.60 with follow-through would be the signal most trend systems use to flip from long to flat or short.
Swing traders
Silver's daily sigma is 3.77% — at $67.58, a one-sigma daily move is $2.55. The $67.79 support at score 87 is the first structural level below the 200-day. A hold there followed by a close above $69.25 resistance is the cleanest long setup the structure offers.
Long-term investors
The structural bull case — energy transition, EV adoption, solar expansion — has not changed. A 44% correction from the ATH, testing a three-and-a-half-year support level, is the test of the thesis. A weekly close below the 200-day with follow-through would be the structural signal to reassess.
WHAT TO WATCH — THE ENGINE'S FORWARD SIGNALS
Five specific triggers that will tell me which story this market is writing.
| # | Trigger | What it means |
|---|---|---|
| 1 | Daily close above $69.25 with continuation | First signal the 200-day held and buyers are stepping in. |
| 2 | Daily close below $67.60 with non-recovery session | Two-bar confirmation of a genuine break vs stop-hunt. |
| 3 | FXI_EMSTRESS direction | Industrial demand macro — most specific to silver. |
| 4 | FXI_RISKON continuation | Broad risk appetite tailwind for commodities. |
| 5 | Pending transition Full Storm → Thin Ice | Engine de-escalation confirmed while price holds 200-day. |
Live Updates · Free access · See the live XAG/USD regime read →
Regime Intelligence · Engine data as of June 5, 2026 20:00 UTC · This report represents the personal opinion of the author based on engine data. Not financial advice.